Tutorial for browsing and searching the GCMS-ID
GCMS-ID Web server: The webserver can be reached at https://www.gcms-id.ca. Once users type this web address in the browser, they will reach the website as shown in the Fig.1 below.

GCMS-ID:GCMS-ID (Gas Chromatography Mass Spectrometry compound IDentifier) is a webserver (https://www.gcms-id.ca) designed to help researchers identify compounds, annotate GC-MS spectra and label GC chromatograms from GC-MS experiments. GCMS-ID would be particularly useful for those working in the fields of metabolomics, exposomics, drug testing, natural product characterization and environmental chemistry. GC-MS experiments produce both electron impact mass spectra (EI-MS) and retention index (RI) data. Matching measured EI-MS, RI or EI-MS + RI data to known (or predicted) reference RI, EI-MS or RI+EI-MS data enables compound identification in GC-MS studies GCMS-ID allows users to submit either a compound structure (as a SMILES string or as a drawn structure) or experimental GC-MS data (RI, EI-MS and/or RI+EI-MS). If a structure is submitted, GCMS-ID will generate predicted Kovats RI values (for three different types of GC-MS columns) or the predicted EI-MS spectrum for that compound.
The webserver supports these following predictions.
1) Prediction of RI from a submitted structure
2) Prediction of EI-MS from a submitted structure
3) Annotation of an EI-MS spectrum from a submitted EI-MS spectrum and a submitted structure
4) Compound identification from submitted RI values and EI-MS spectrum
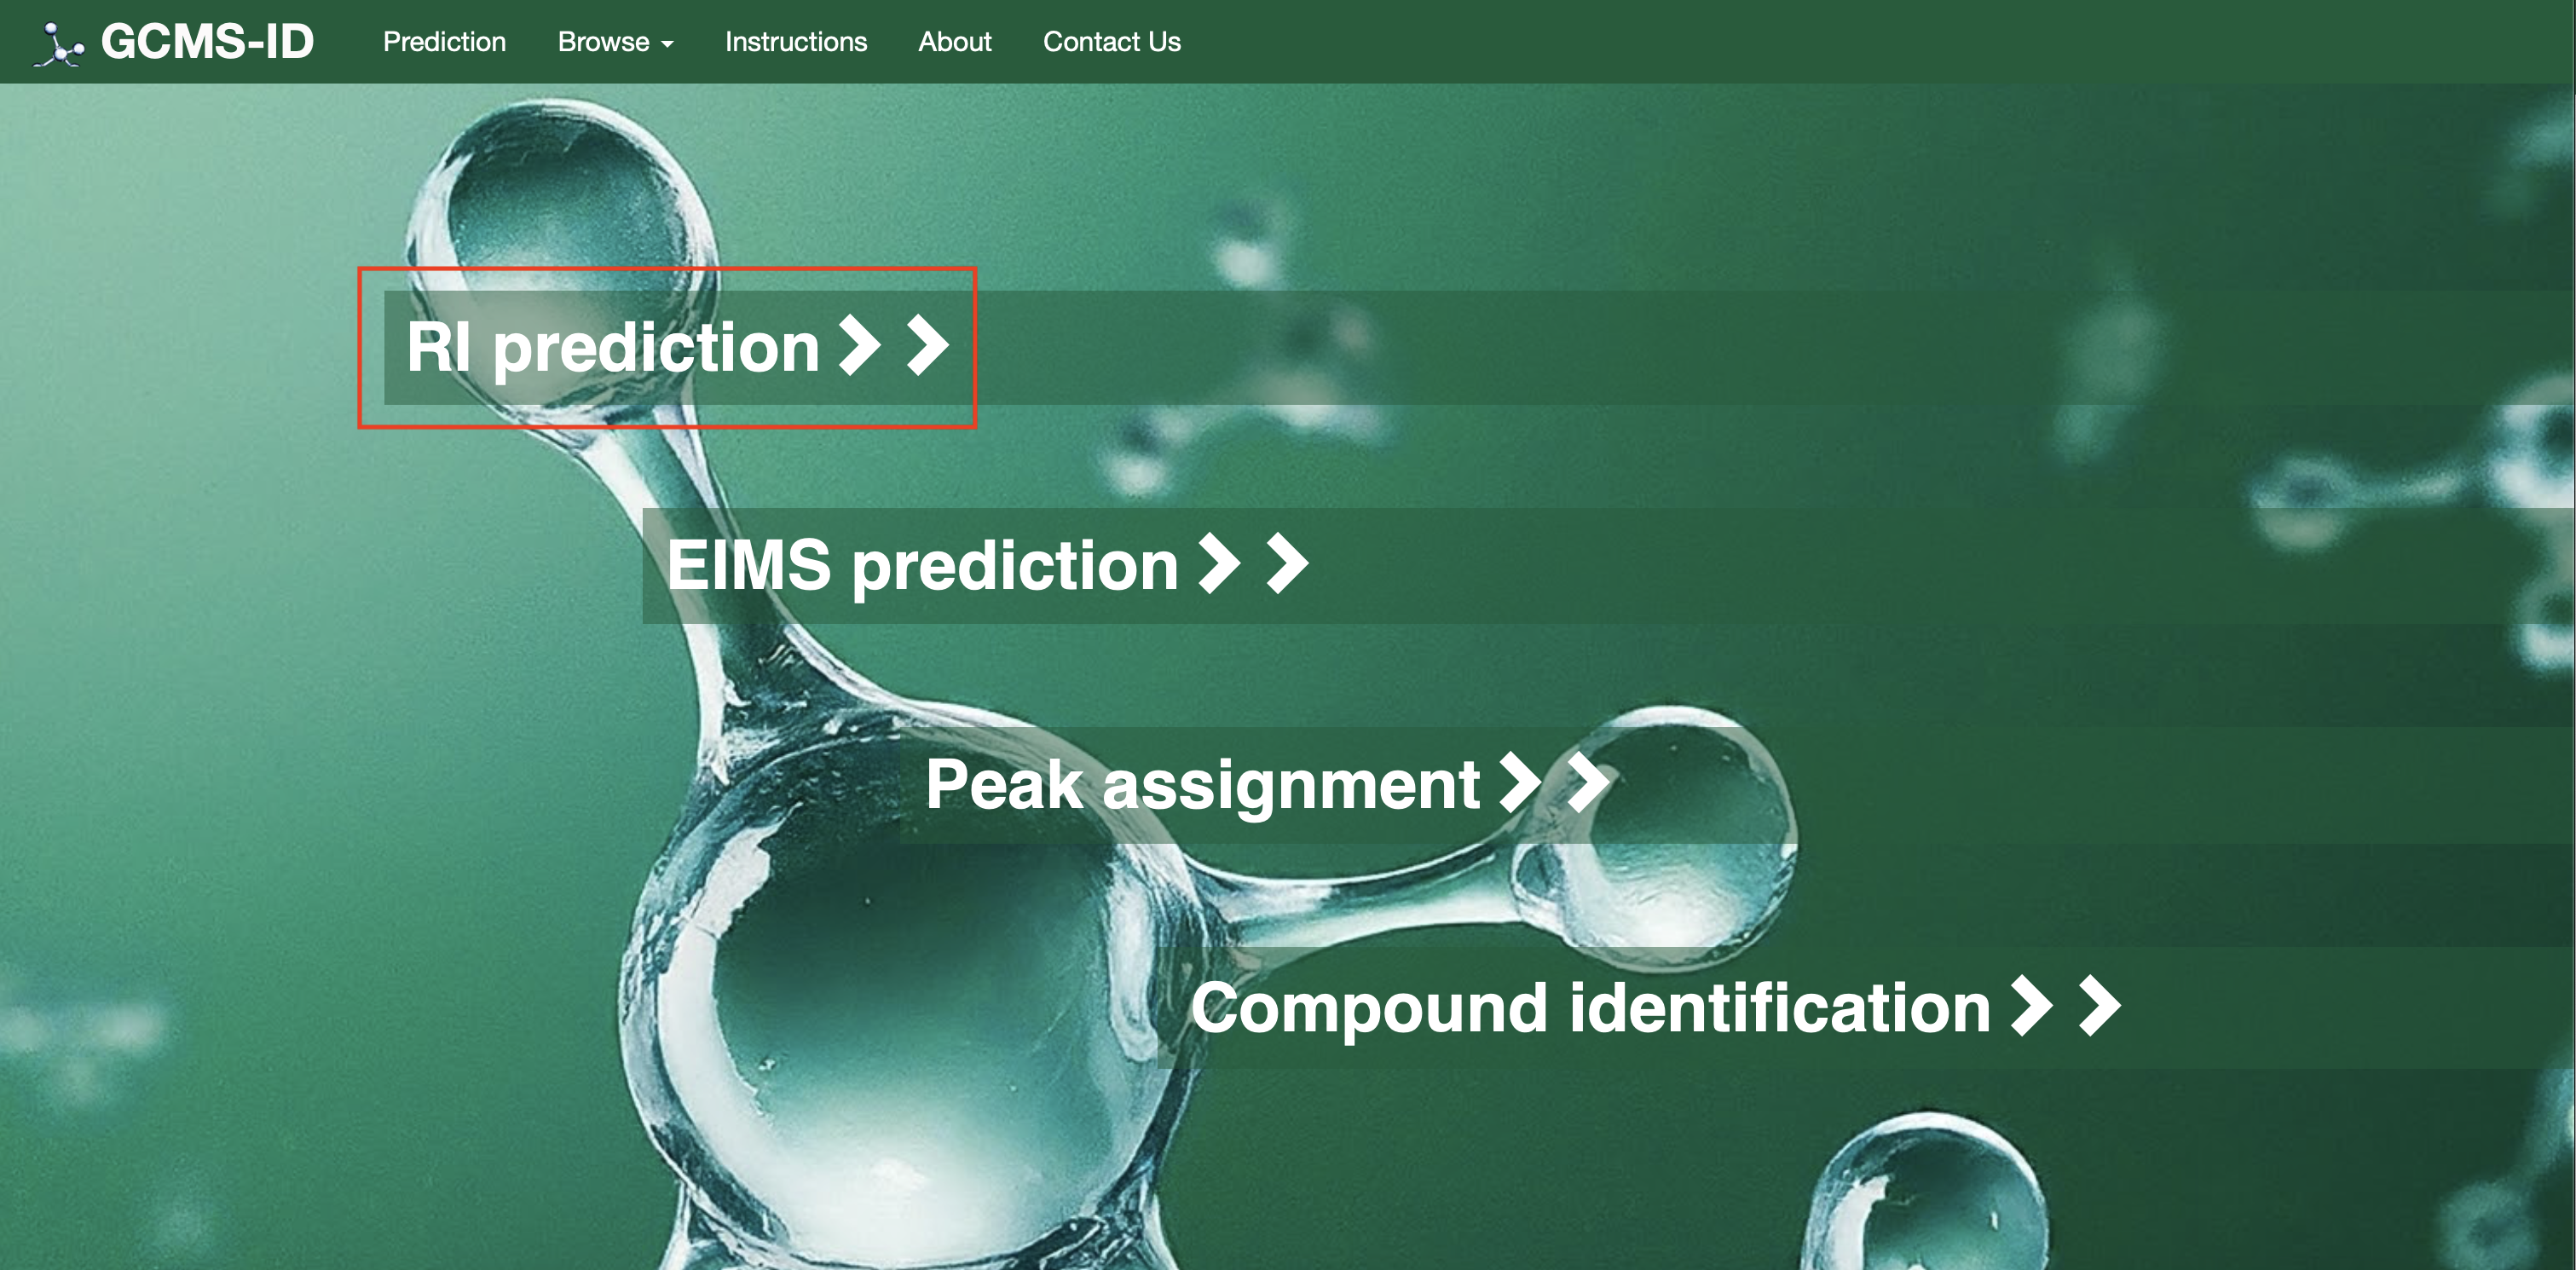
For Option #1[RI Prediction]: Users can click on “RI Prediction” as shown in the Fig. 2(a) below.
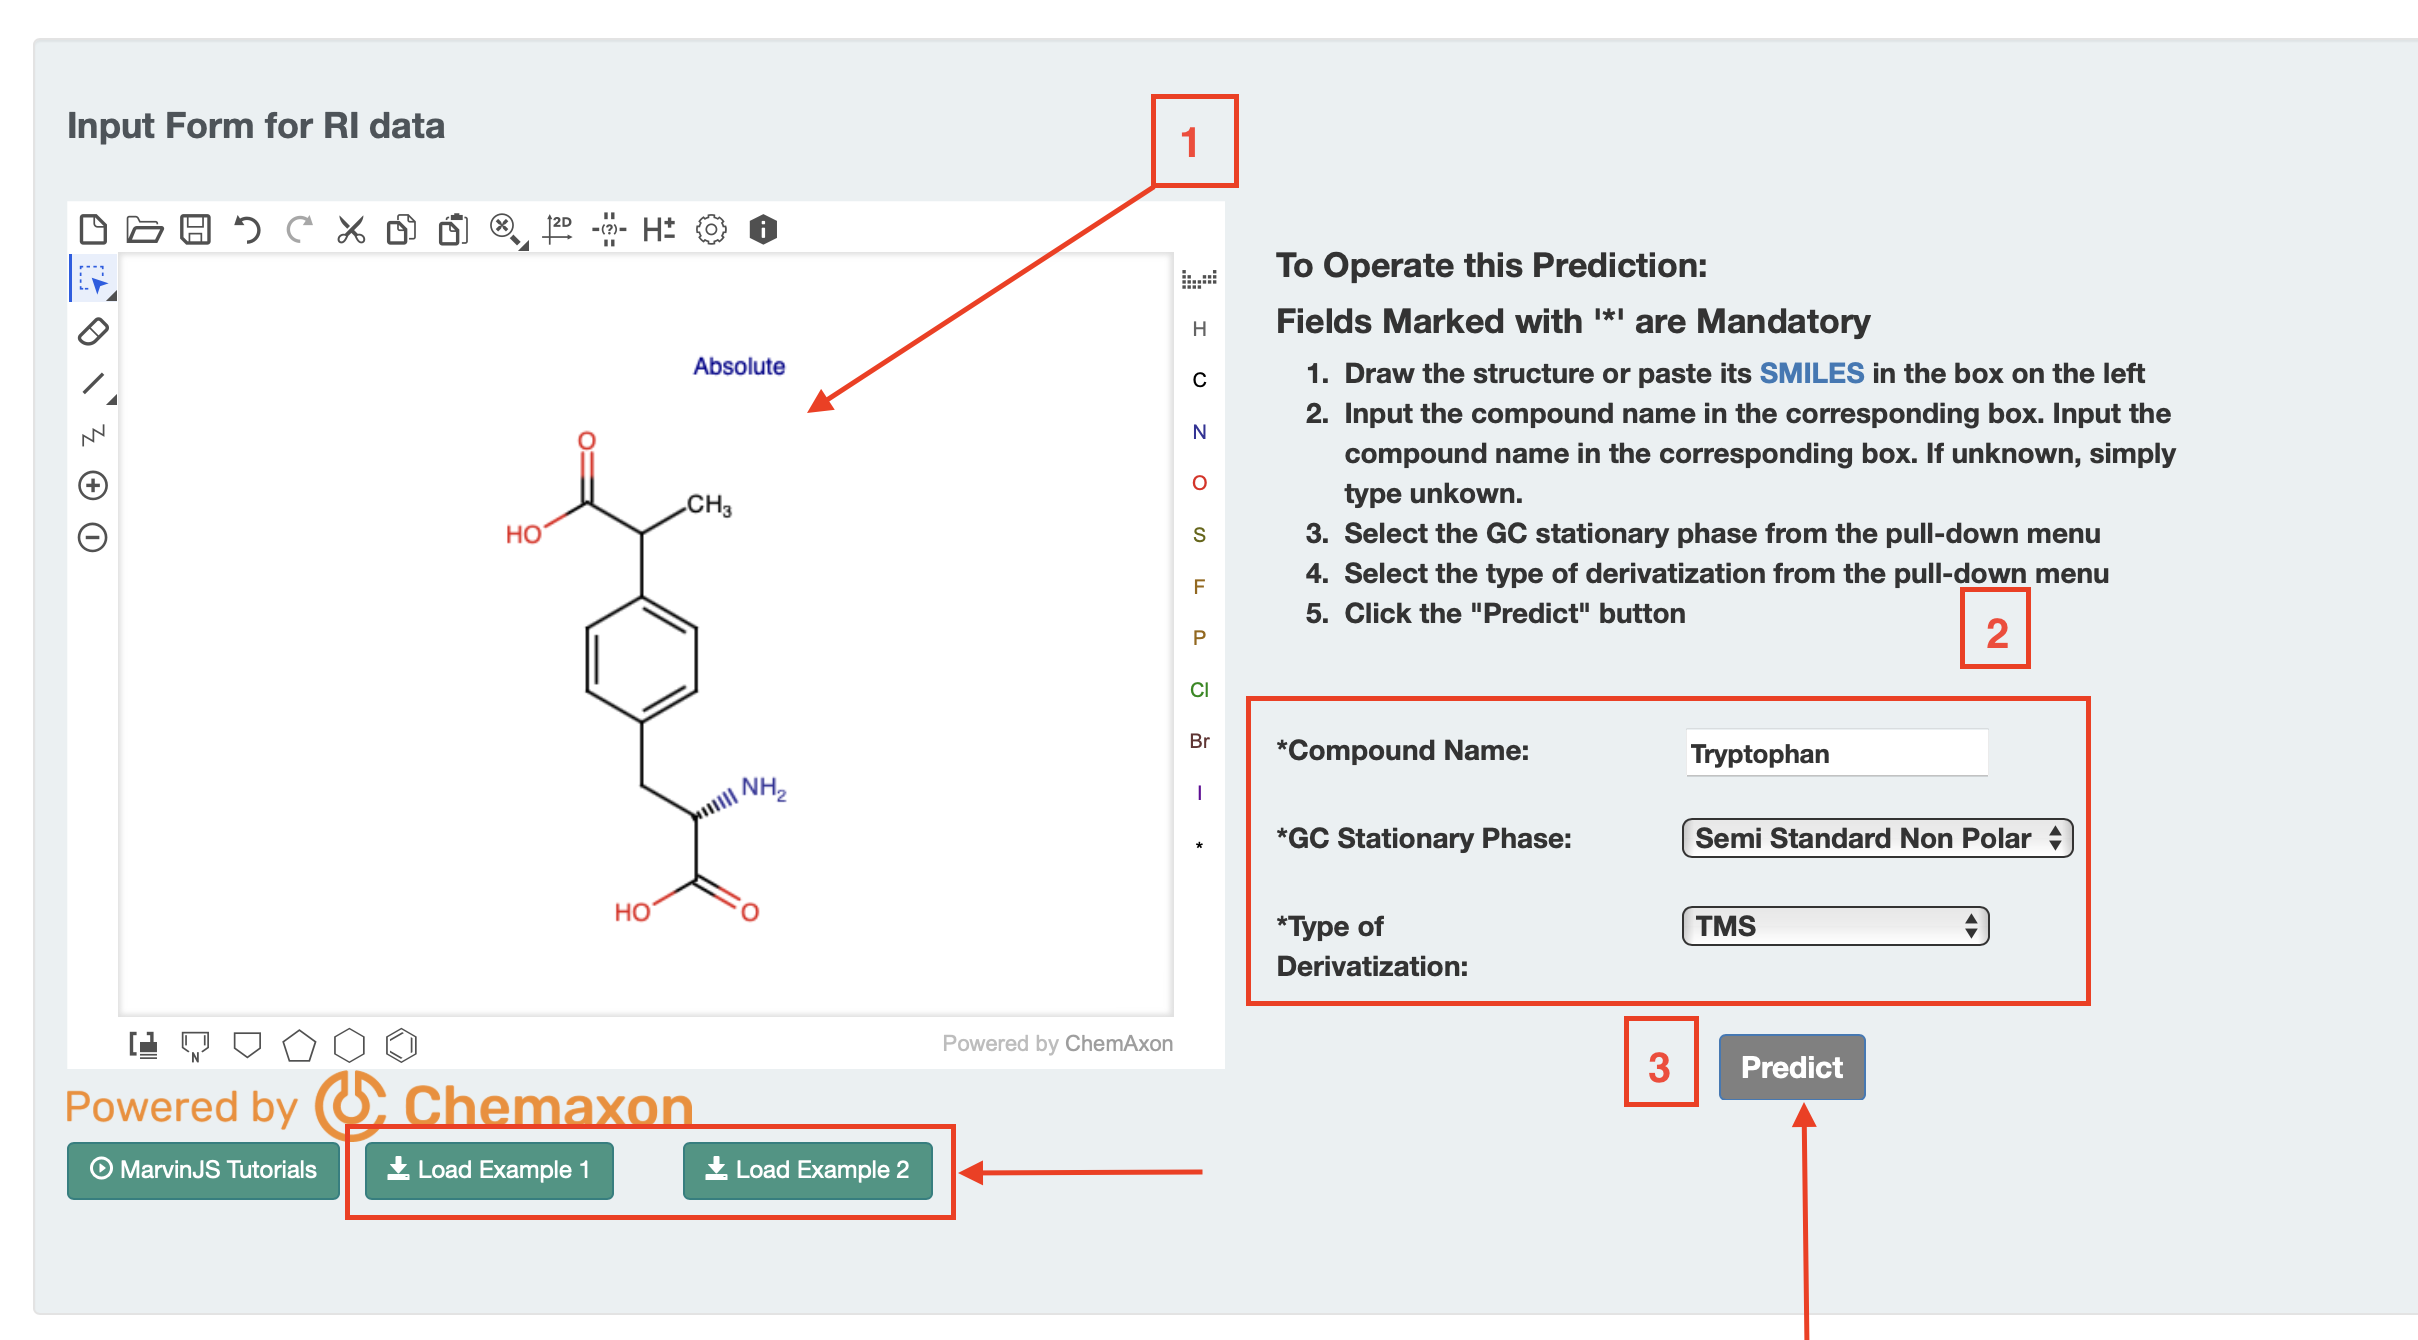
Users should can to draw a structure into ChemAxon MarvinView (by hand or by dragging a SMILES string into the window). Users need to select these three main options as shown in Fig 2(b) column type, enter a compound name, and the type of derivatization (default none).
Once completed, users can press the submit button and a retention index or list of retention indices is provided on a new page. Two Examples are also provided (Example 1 and Example 2) on the page as shown.
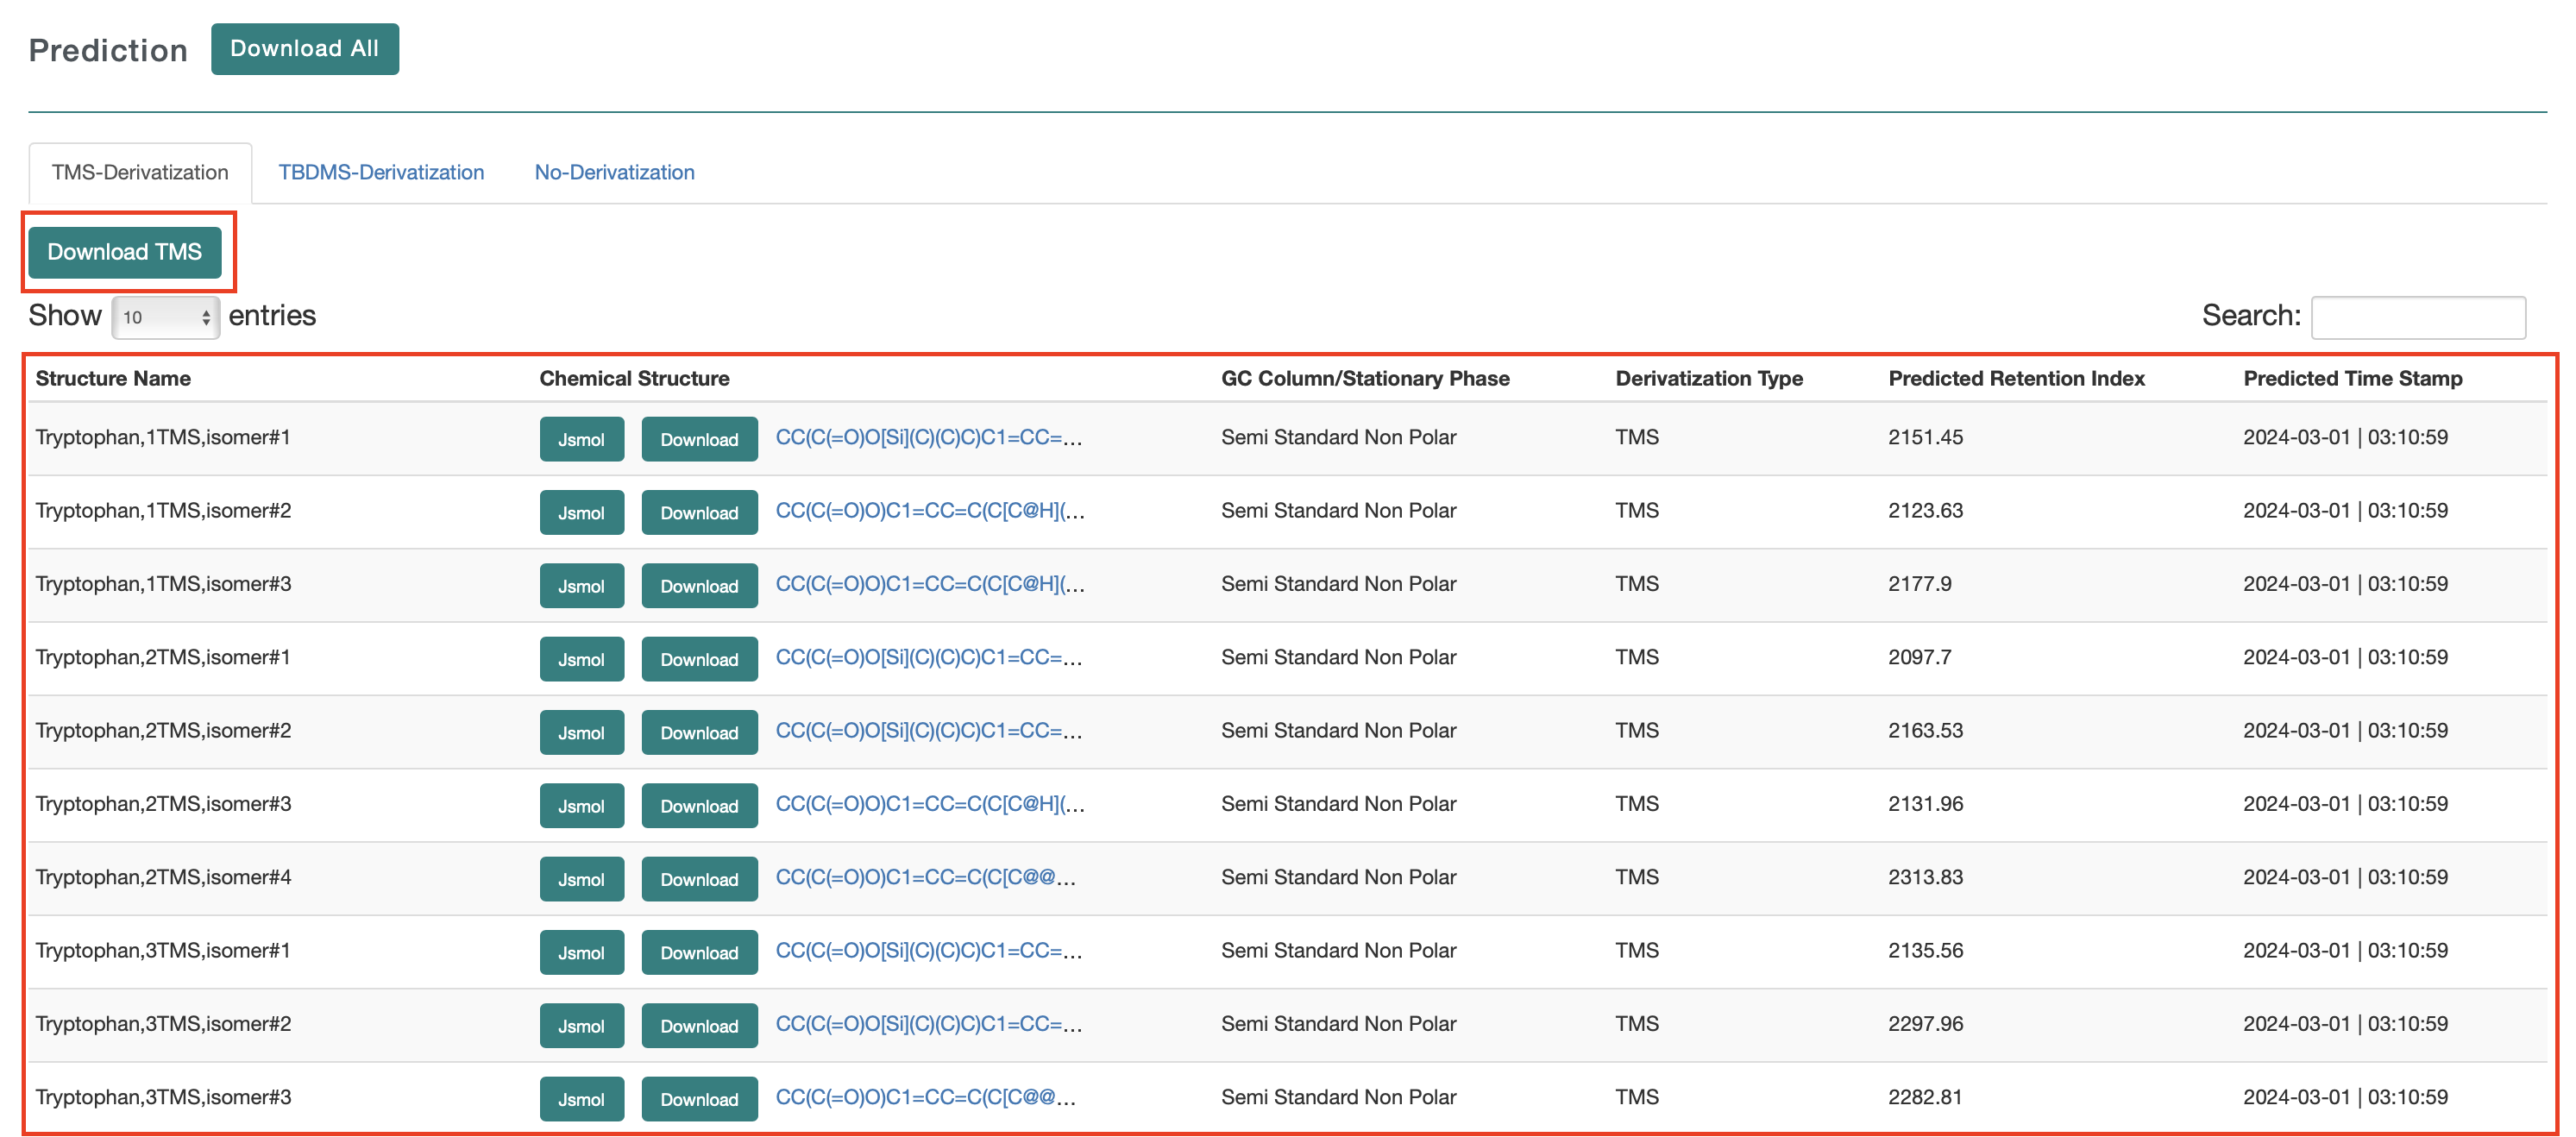
The list shows the structure name, the chemical structure (with links to JSMol, the SMILES string and Download), the GC column type, the derivatization type, the predicted RI and the time stamp.
The results are displayed in the active tab. So, if the users choose TMS, only the TMS derivatives are shown, plus the underivatized compound. If they choose TBDMS, only the TBDMS derivatives are shown, plus the underivatized compound. If they choose no derivatization, only the underivatized compound is shown in Fig 2 (c).Users can download the data from a download button located at the top of the output page.
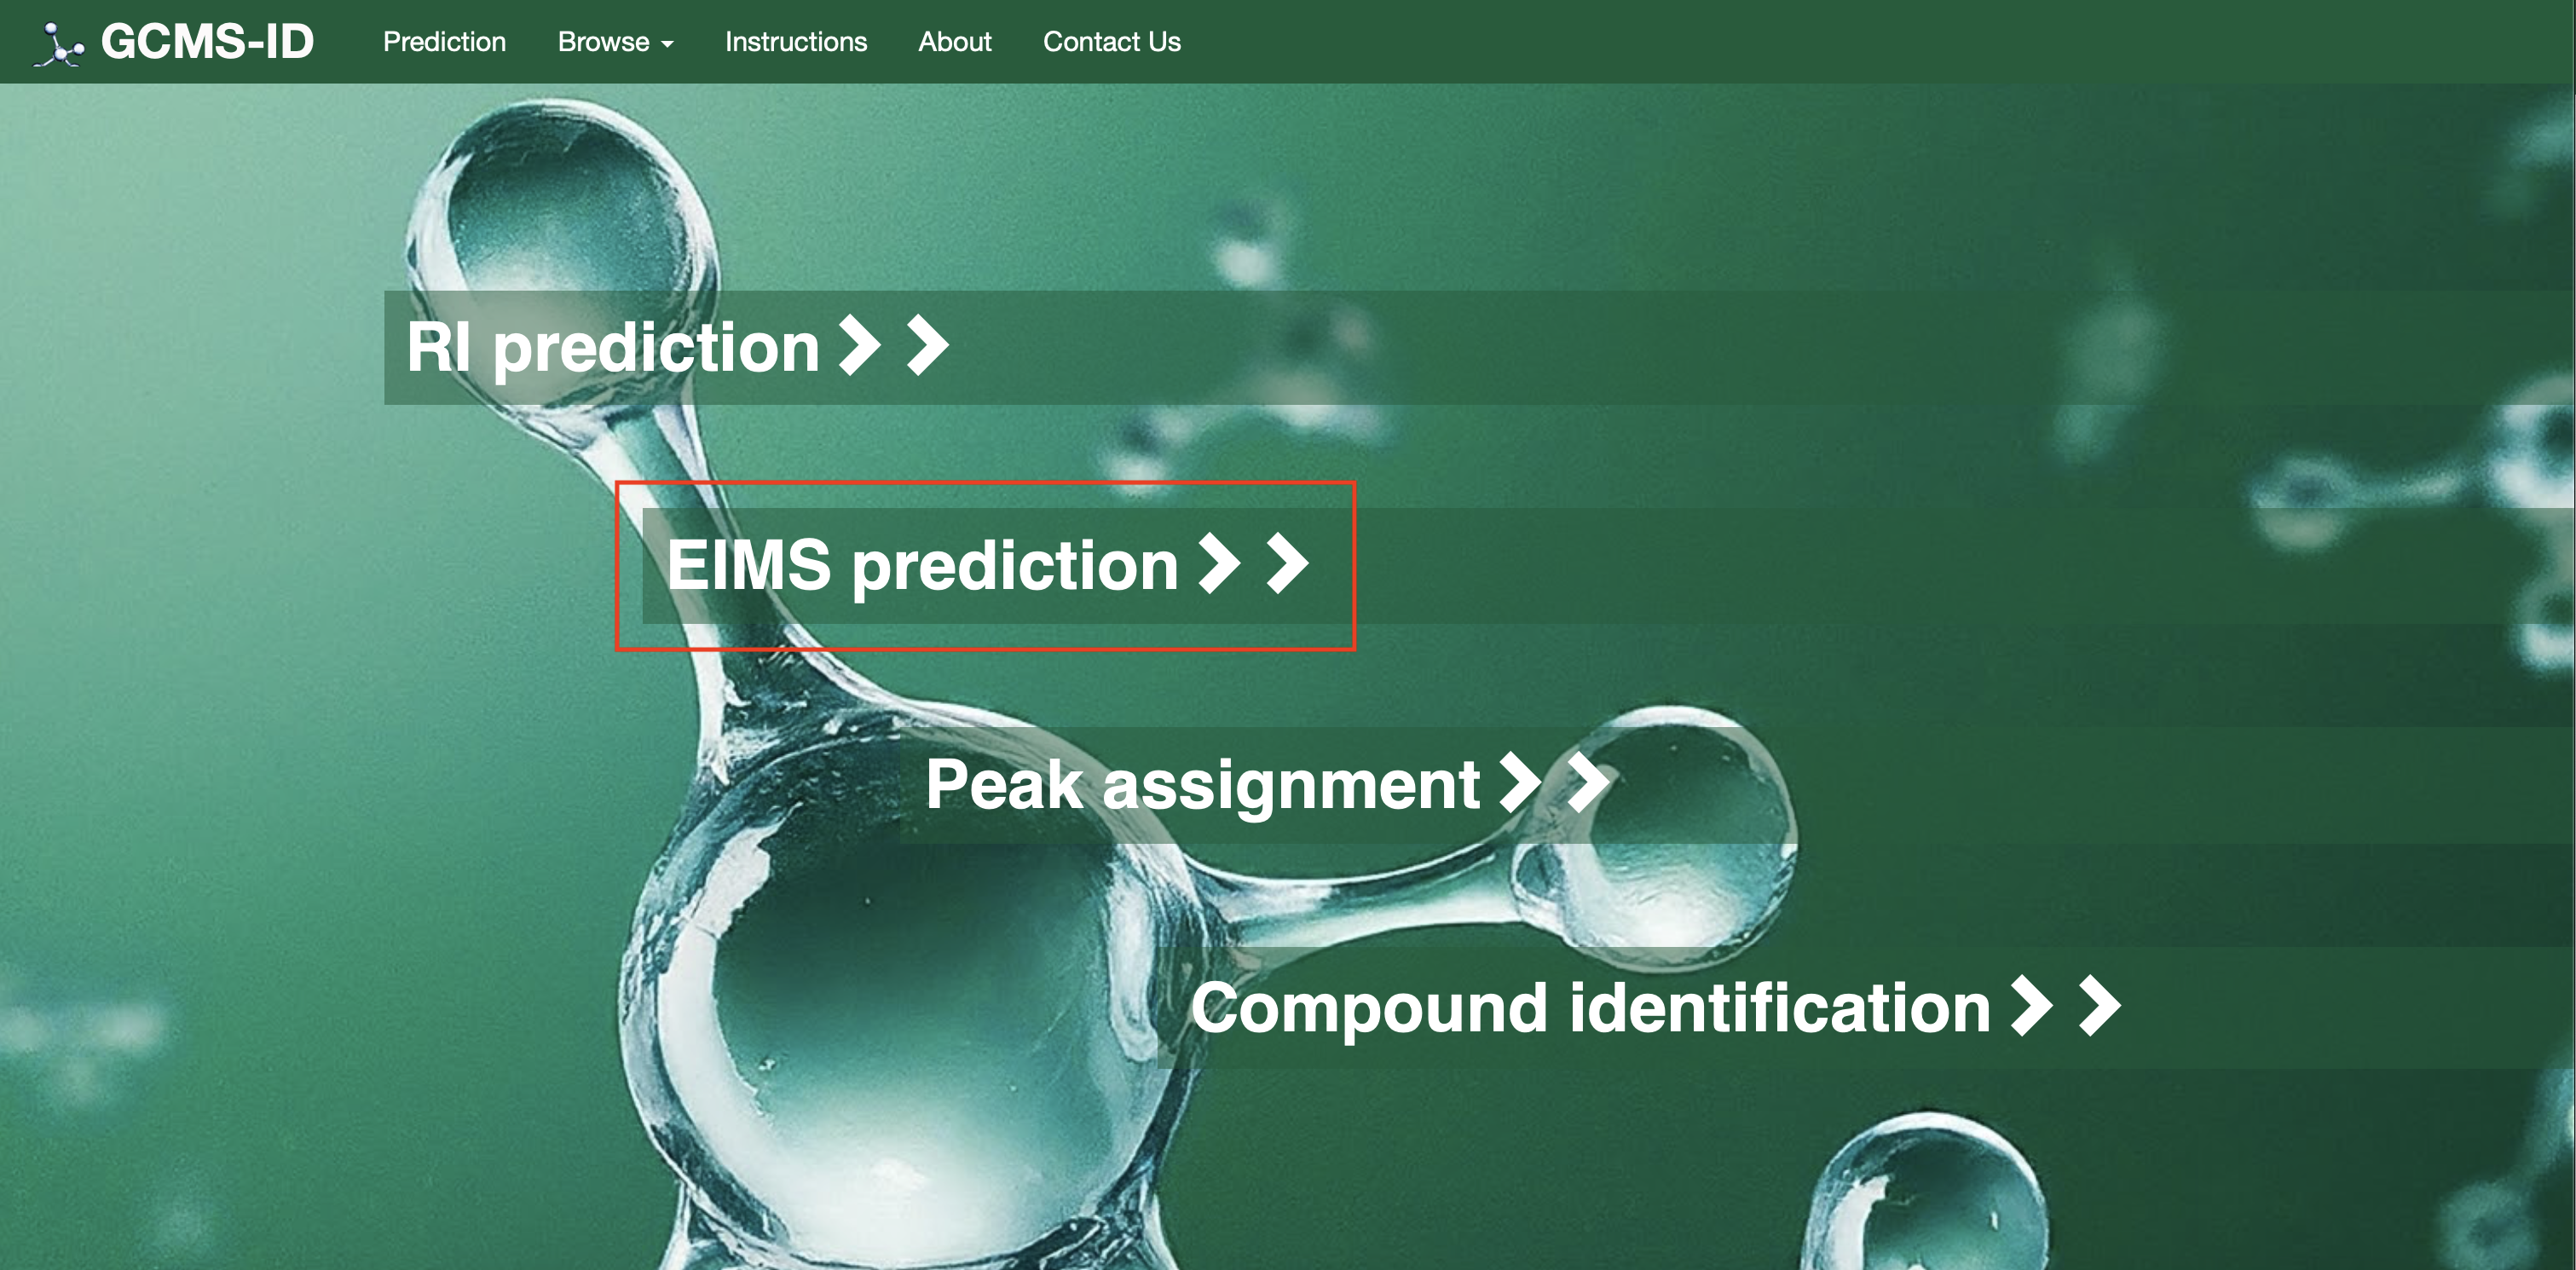
For Option# 2[EI-MS Prediction]: Users need to click on the option “EI-MS prediction” as shown in Fig 3 (a)
To use this option, users can the draw a structure into ChemAxon MarvinView (by hand or by dragging a SMILES string into the window). Users must enter the compound name and the type of derivatization (default none). Two Examples are also provided (Example 1 and Example 2) on the page as shown. Once completed, users can press the submit button as shown in Fig.3(b) and a table or list of predicted EI-MS spectra is provided on a new page.
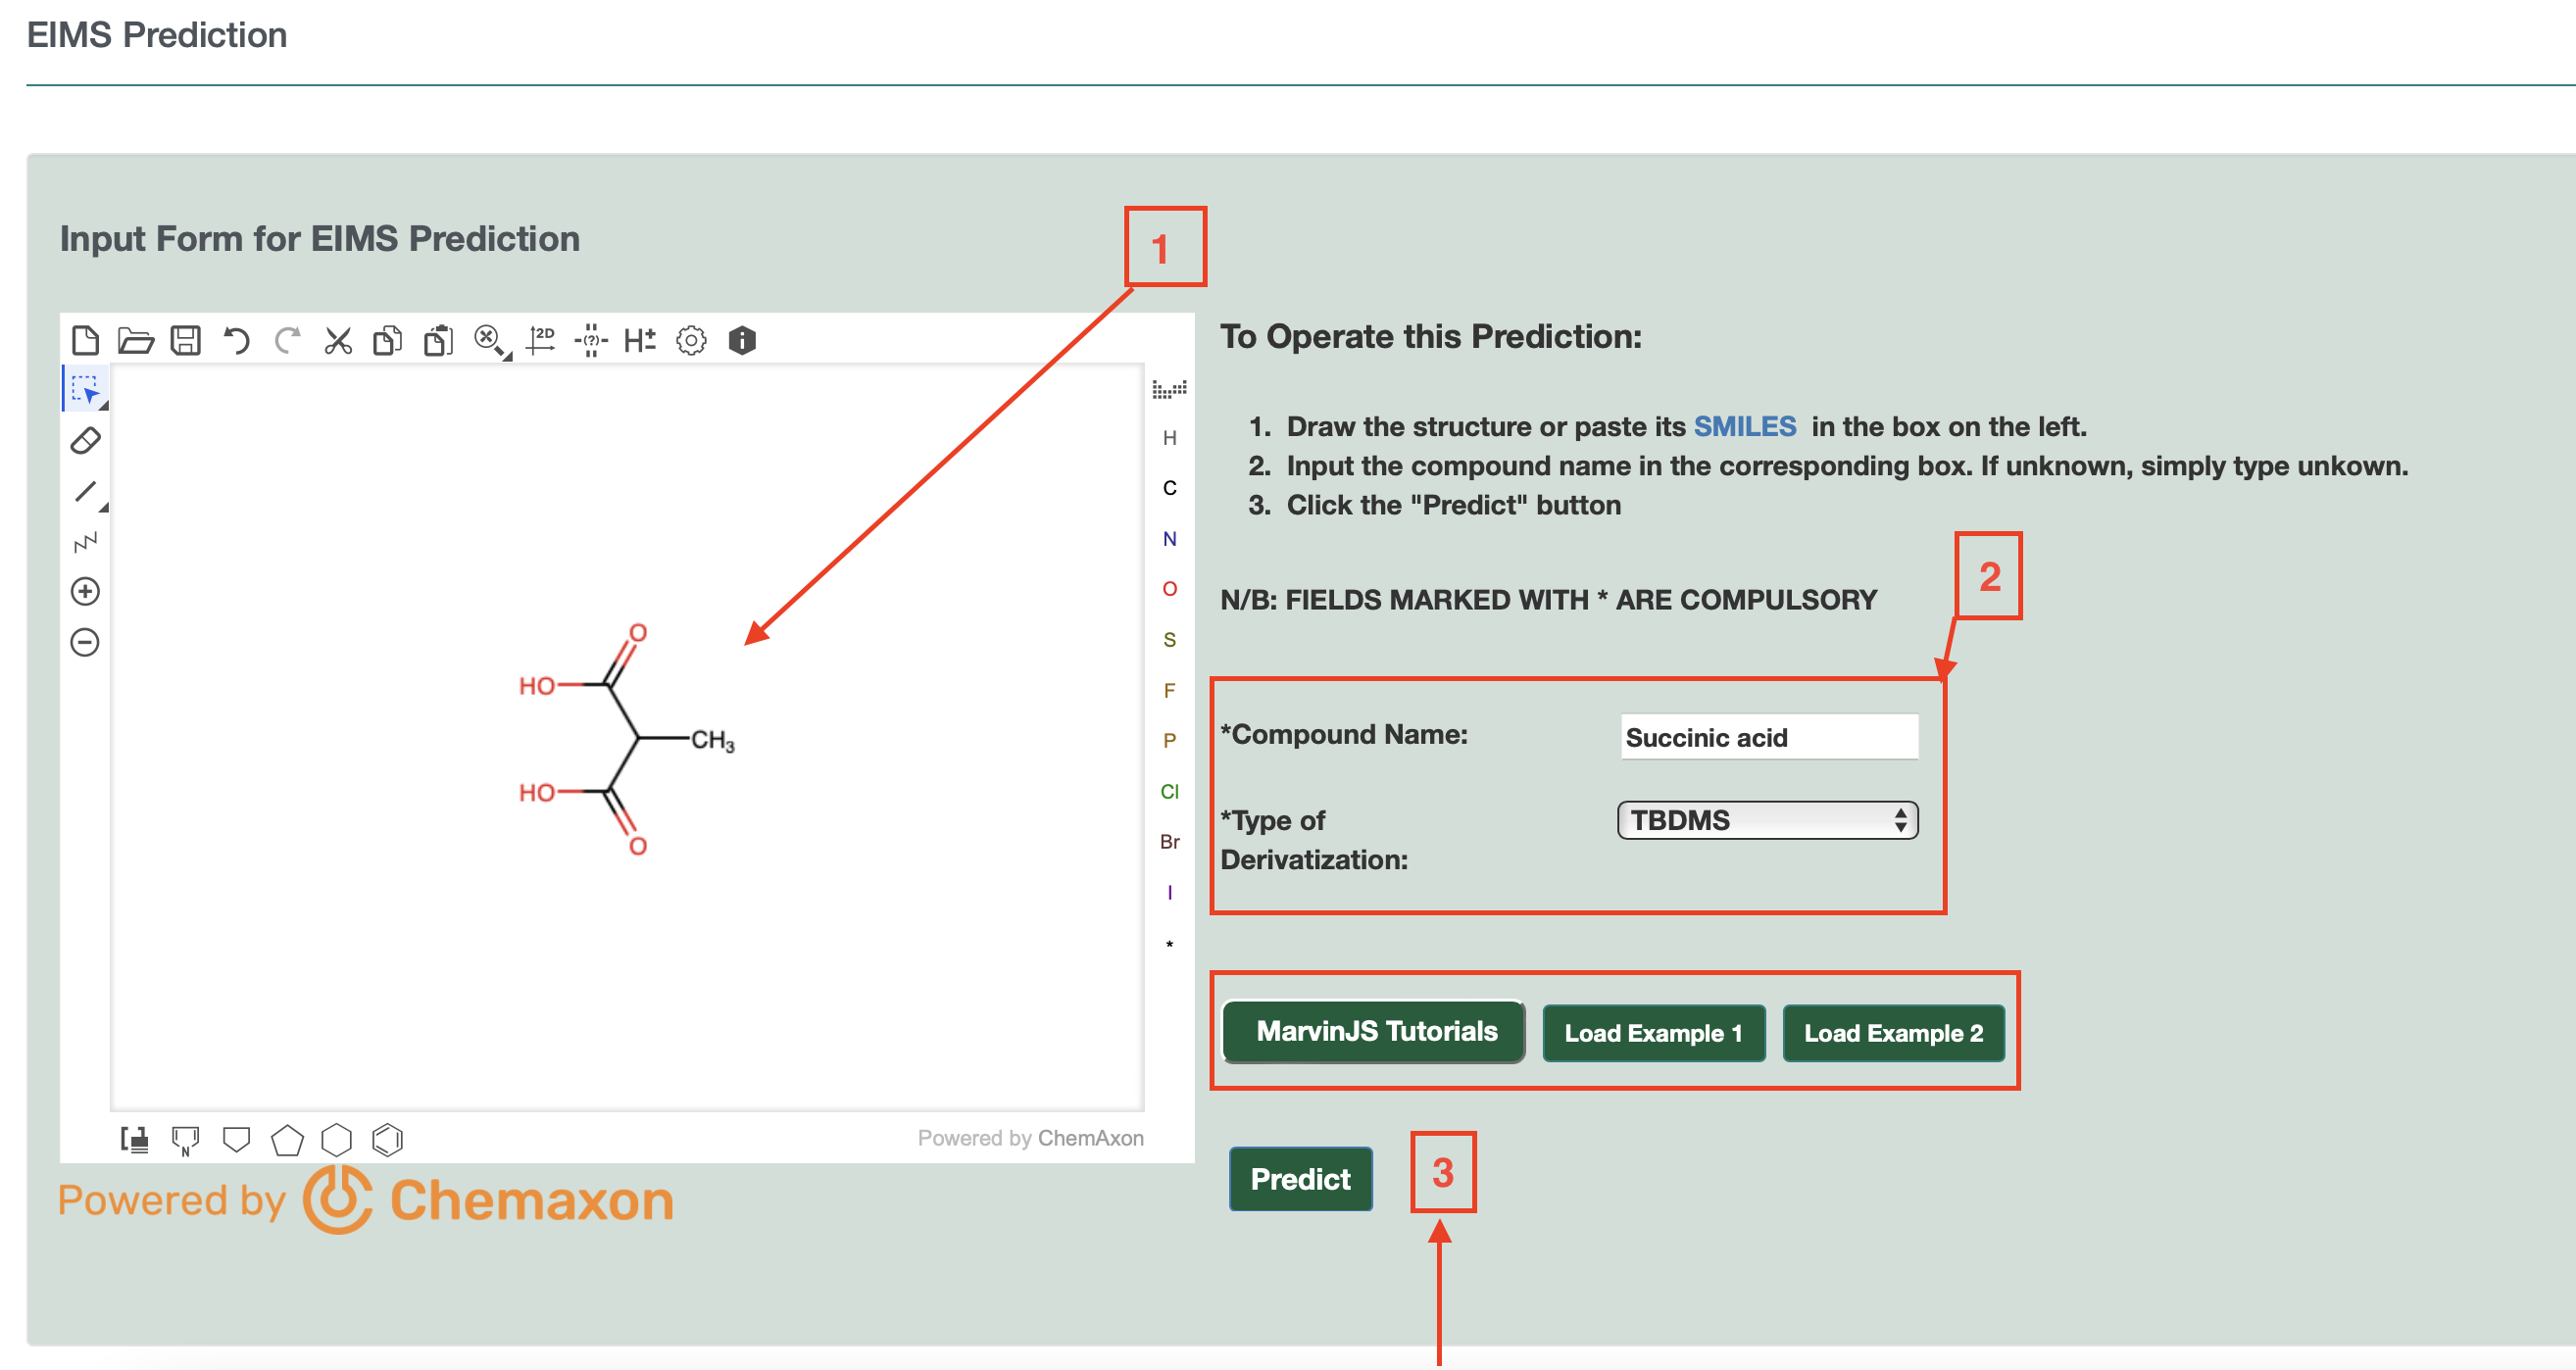
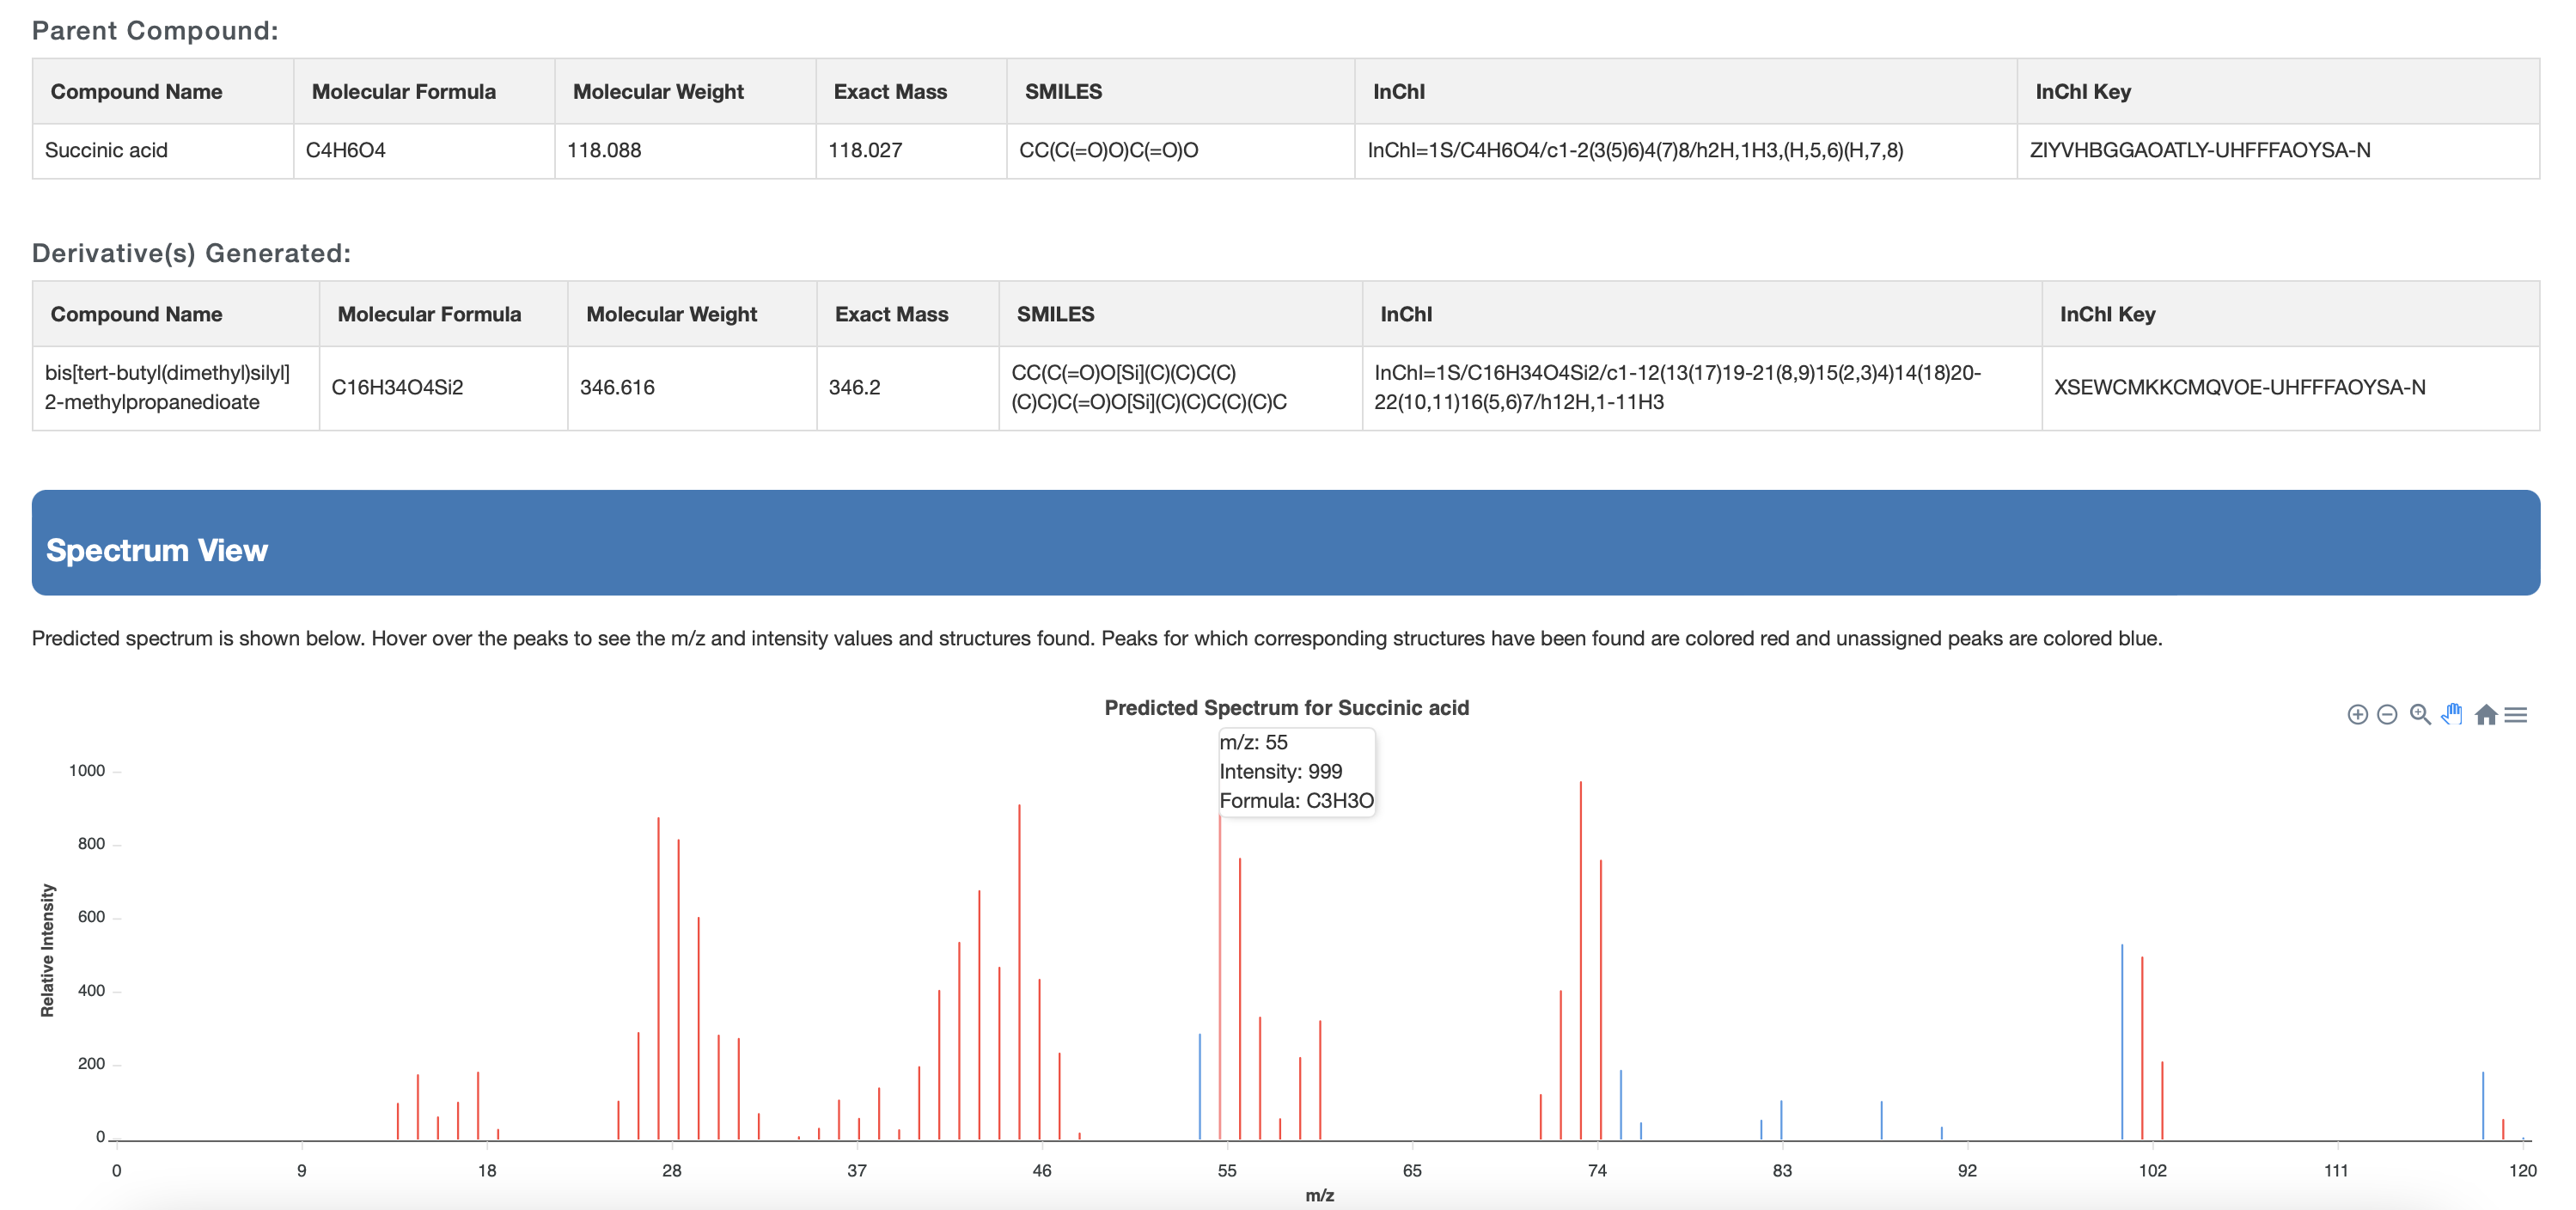
The list shows the structure name, the chemical structure (with links to JSMol, SMILES string and Download), the derivatization type, the predicted EI-MS spectrum (with link to JSView) and the time stamp.
The output results are displayed again in the “active” tab display. So, if the users will choose TMS, only the TMS derivatives tab will active, plus the underivatized compound.
If they choose TBDMS, only the TBDMS derivatives will be shown, plus the underivatized compound.
If the users choose no derivatization, only the underivatized compound is shown. Two Examples must be provided (Example 1 and Example 2) on the website. Users can download the data from a download button located at the top of the output page as shown in Fig 3(c)
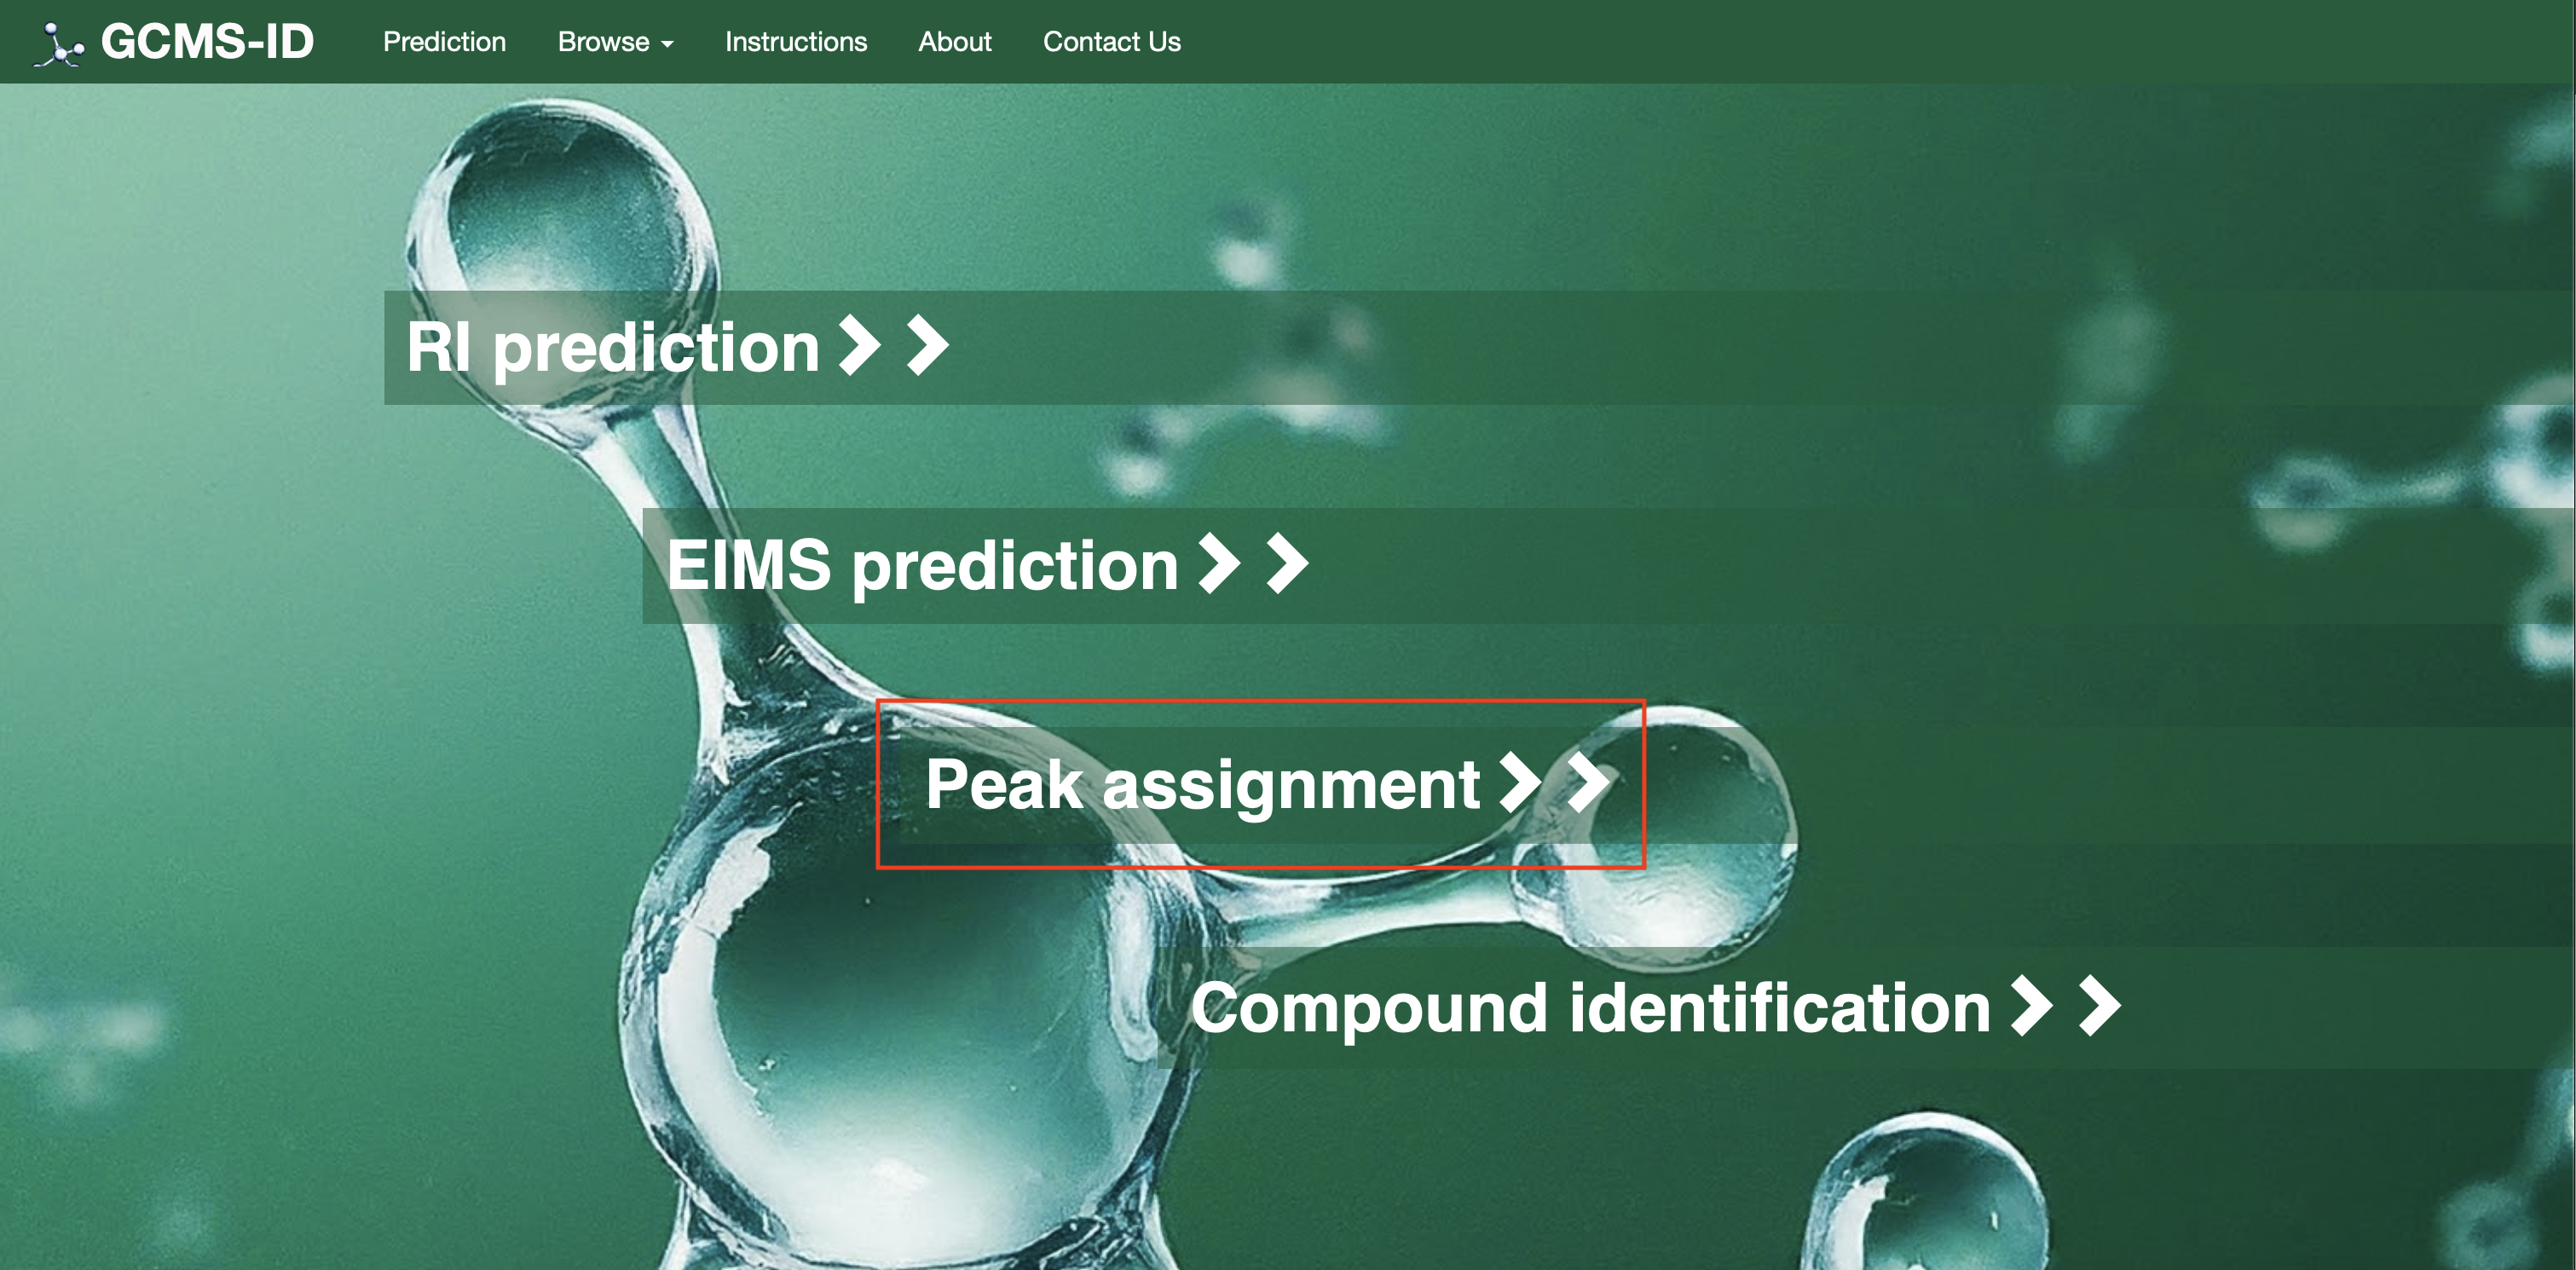
For Operation #3[Peak Assignment]: Users need to click on the option “Peak Assignment” as shown in Fig. 4(a). Users can draw a structure into ChemAxon MarvinView (by hand or by dragging a SMILES string into the window) and enter the peak list (masses and intensities) of their EI-MS spectrum into a box as shown in Fig. 4(b). Two Examples are also provided (Example 1 and Example 2) on the page as shown.
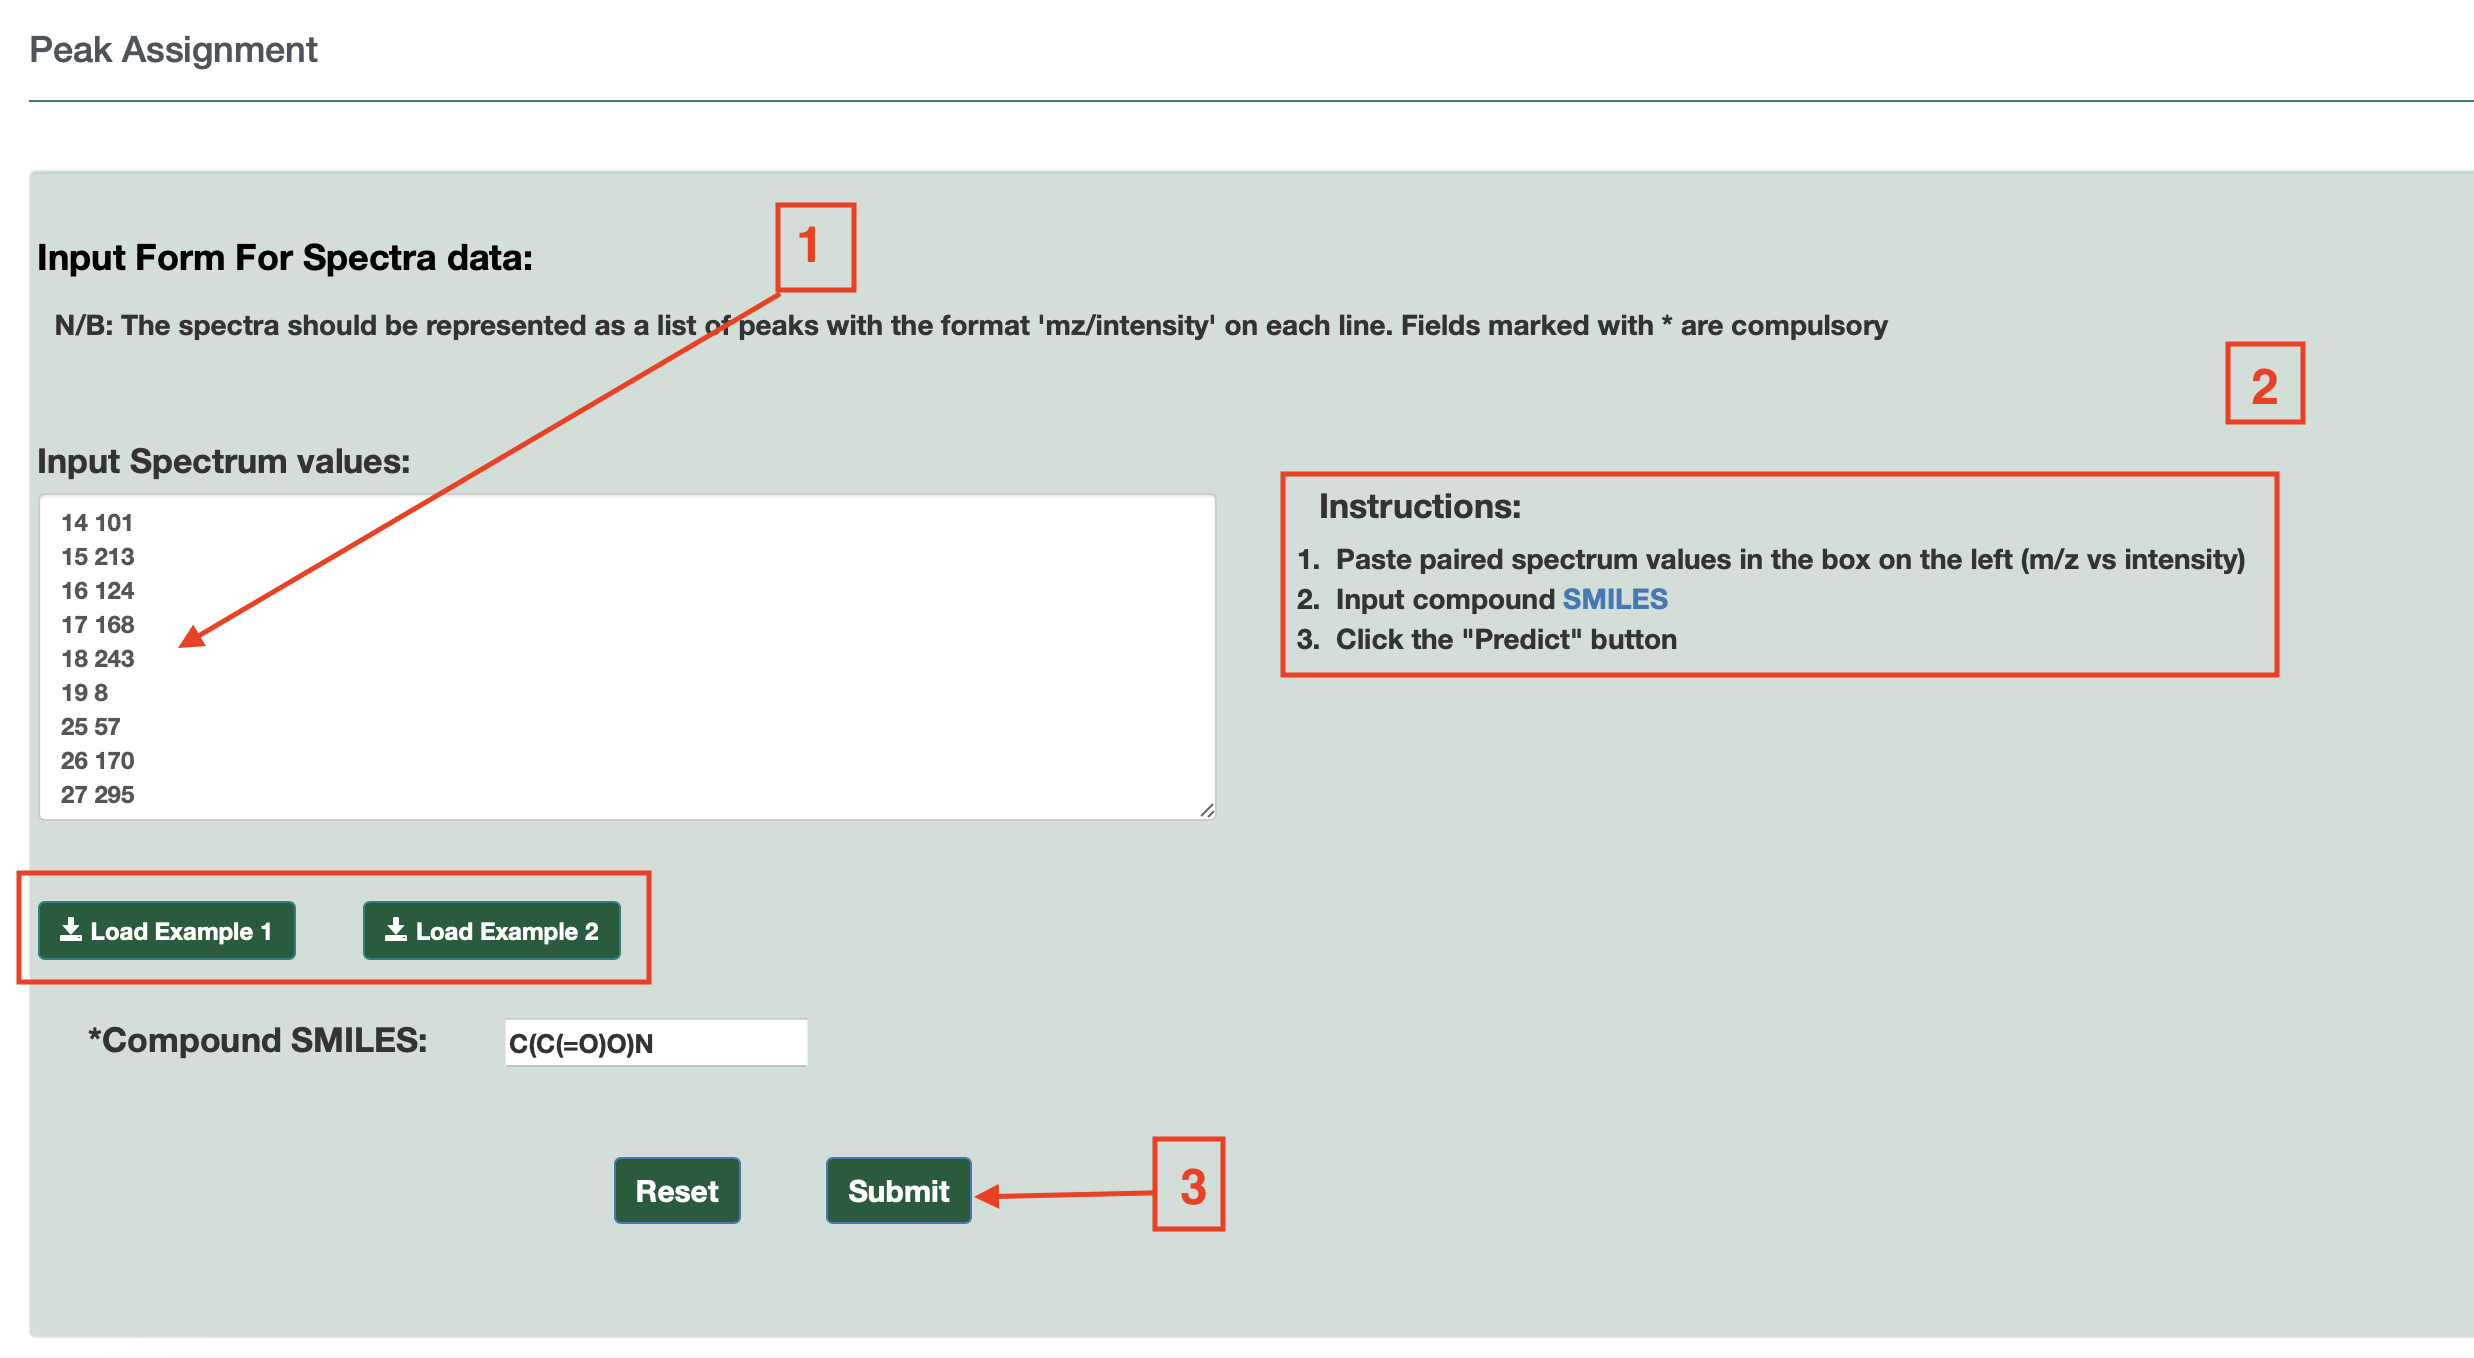

Users must enter the compound name. Once completed, users can press the submit button and the annotated EI-MS spectra is provided on a new page via JSmirror plot as shown in Fig. 4(c). The peak annotations (with chemical formulas and masses) are be shown on the display – either above the peaks or below the peaks. Users can download the data from a download button located at the top of the output page.
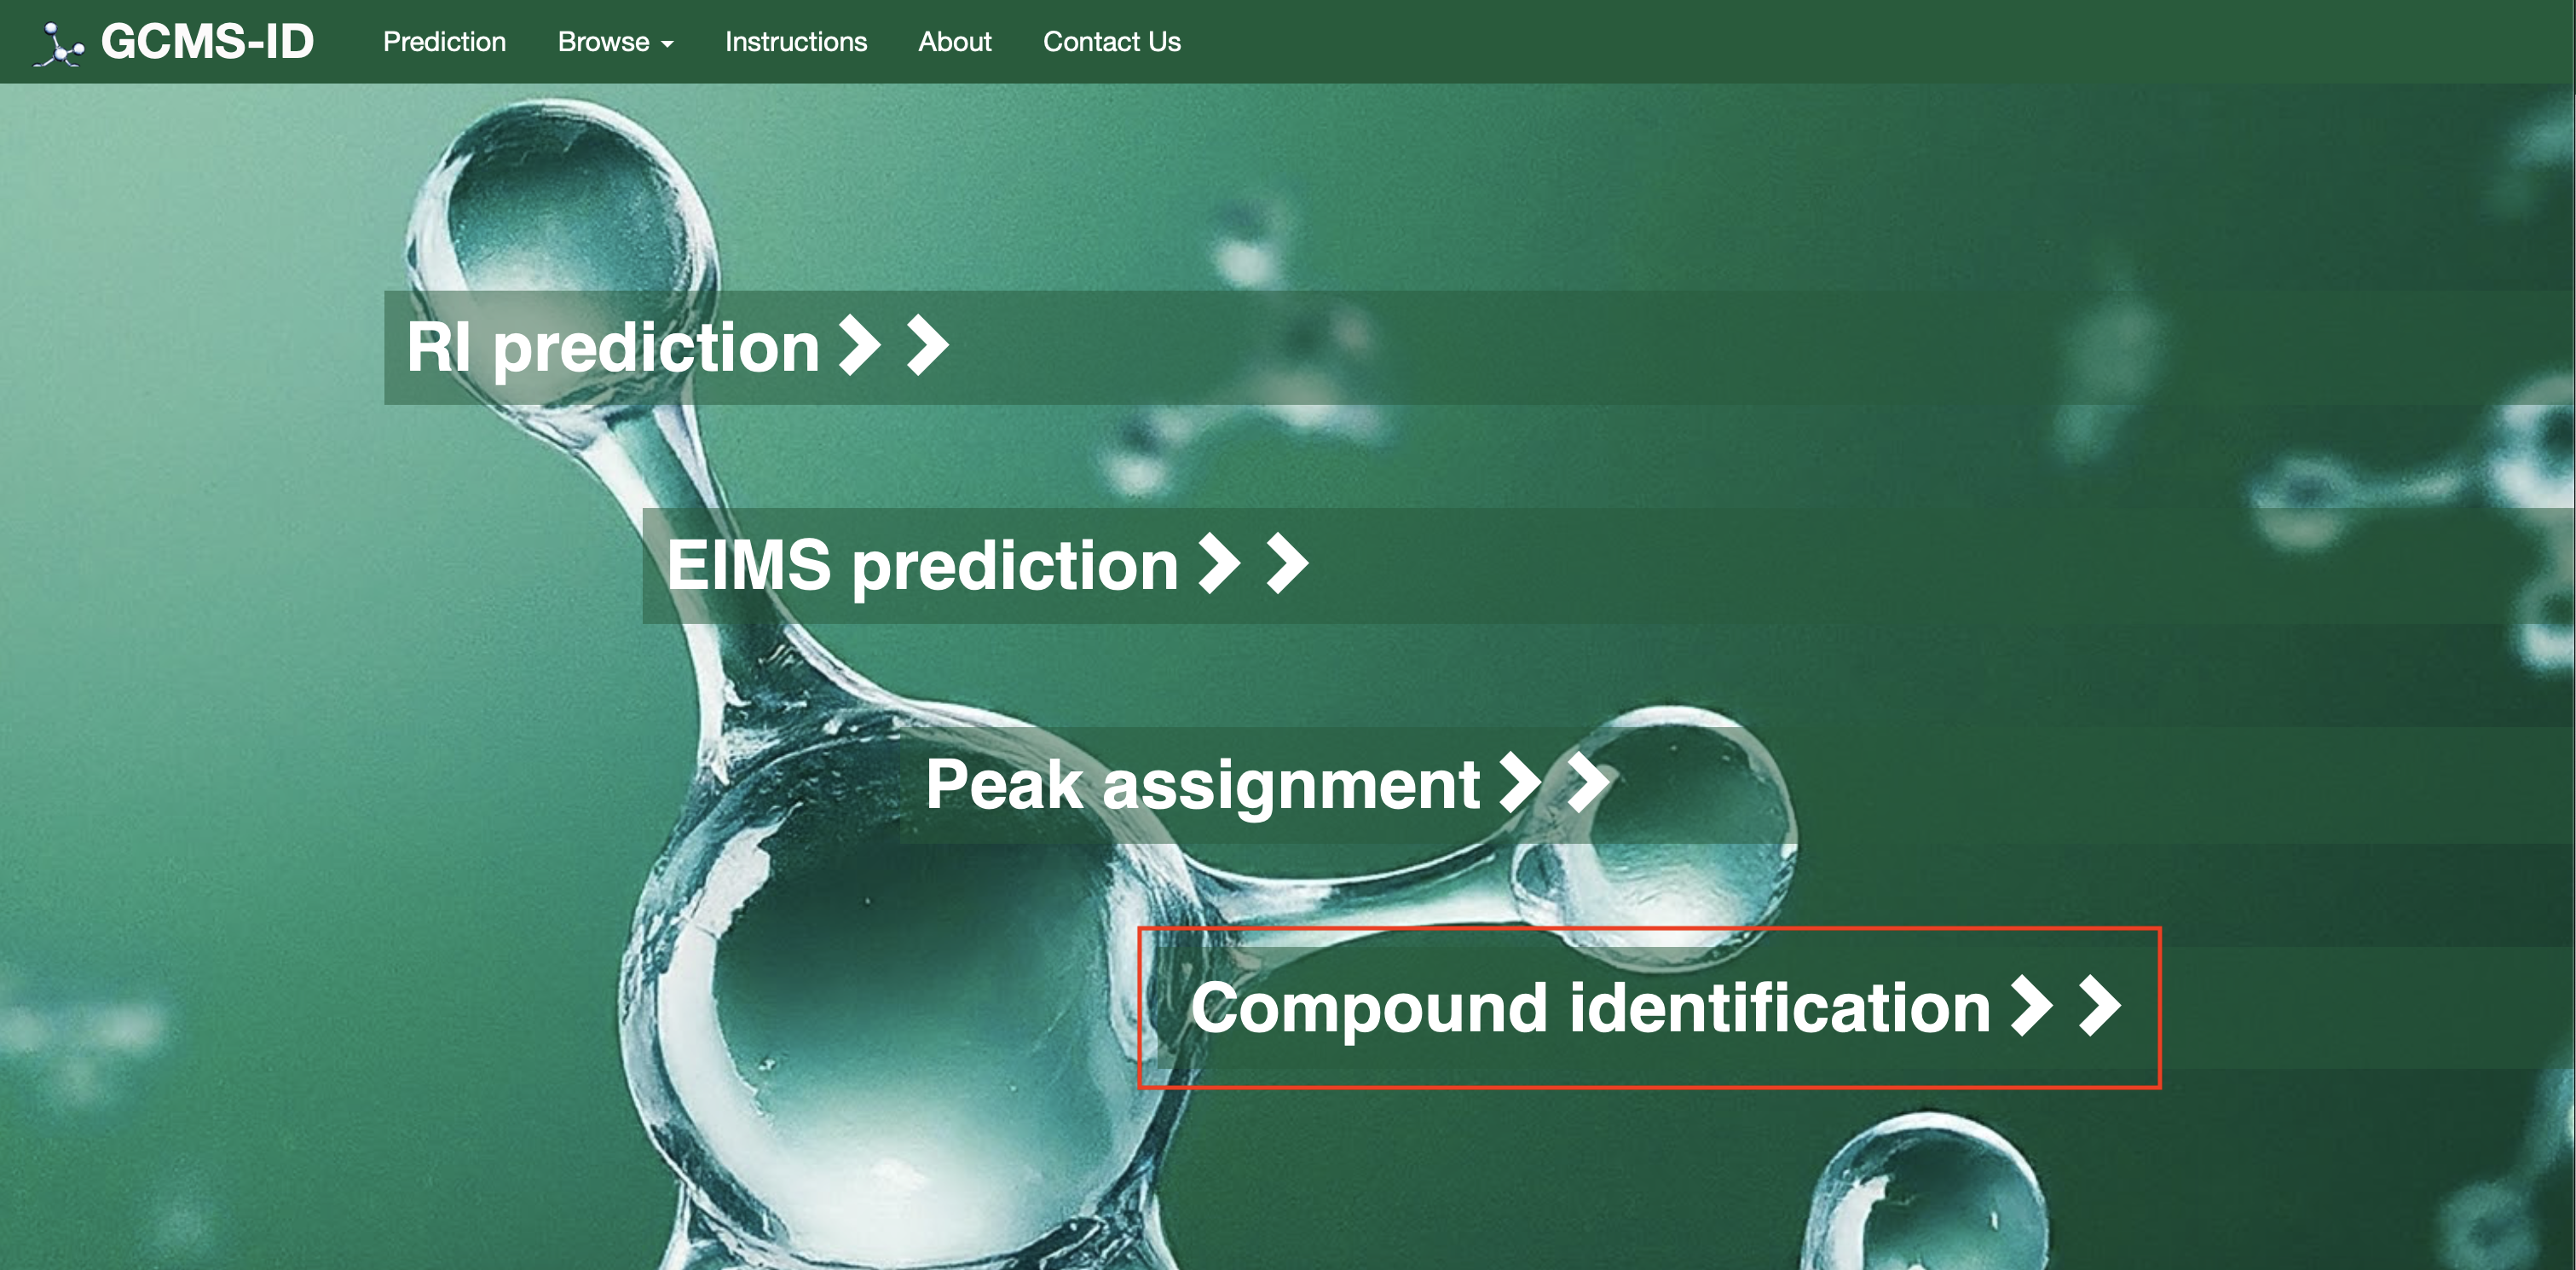
For Option 4, [Compound Identification]: To use this option, users can click on the “Compound Identification on the landing page as shown in Fig. 5(a).
Next, users can enter a retention time, the allowed retention time tolerance (default – 2%), the column type, the type of derivatization (default none). Users have the option to search the compound databased in the dropdown (choice of HMDB, NIST compounds and HMDB+NIST) as shown in Fig. 5(b)
Once completed, users can press the submit button and a table or list of closely matching RIs is provided on a new page. The list shows the structure name, the chemical structure (with links to JSMol, SMILES string and Download), the derivatization type, the predicted RI, the RI difference (absolute value) and the RI matching score as shown in Fig. 5 (c).
The list should be sorted by the RI matching score.
The matches must be consistent with the type of derivatization chosen. So if they choose TMS, only high scoring TMS derivatives are shown. If they choose TBDMS, only high scoring TBDMS derivatives are shown. If they choose no derivatization, only high scoring underivatized compounds are shown.
For Option 4 (b) [Compound Identification with Spectrum]: Users should be able to enter the peak list (masses and intensities) of their EI-MS spectrum into a box, the type of derivatization (default none) and the compound database to search (choice of HMDB, NIST compounds and HMDB+NIST). Once completed, users can press the submit button and a table or list of closely matching EI-MS spectra is provided on a new page as shown in Fig.6(a)
The list shows the structure name, the hyperlink to the structure in the database, the chemical structure (with links to JSMol, SMILES string and Download), the derivatization type, the predicted EI-MS spectrum hyperlink (viewable by JSmirror plot) and the cosine matching score. The list should be sorted by the cosine similarity matching score.
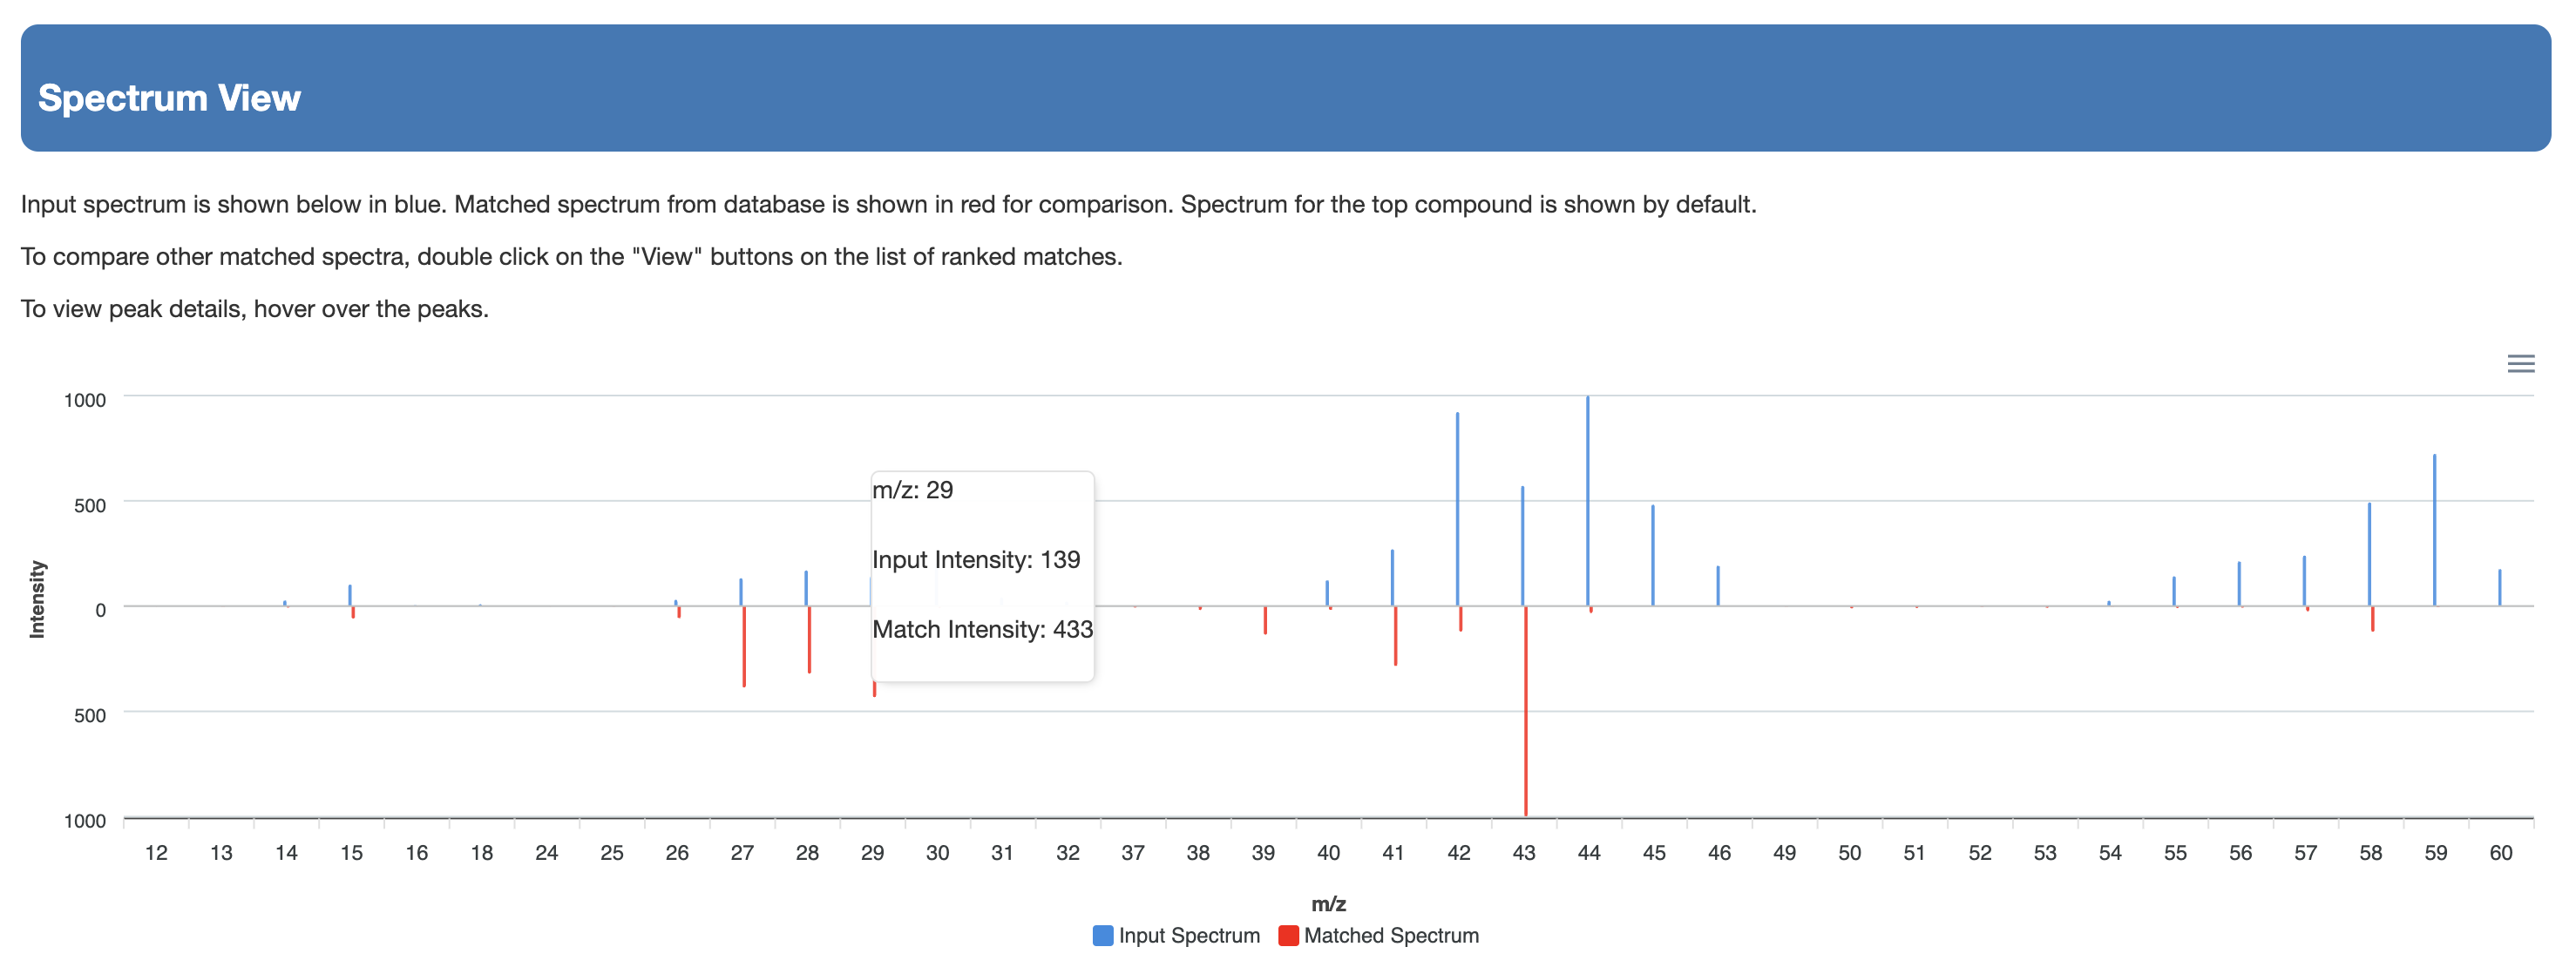
The matches are kept consistent with the type of derivatization chosen. So, if the users choose TMS, only high scoring TMS derivatives are shown. If they choose TBDMS, only high scoring TBDMS derivatives are shown. If they choose no derivatization, only high scoring underivatized compounds are shown. Users can download the data from a download button located at the top of the output page as shown Fig. 6(b)
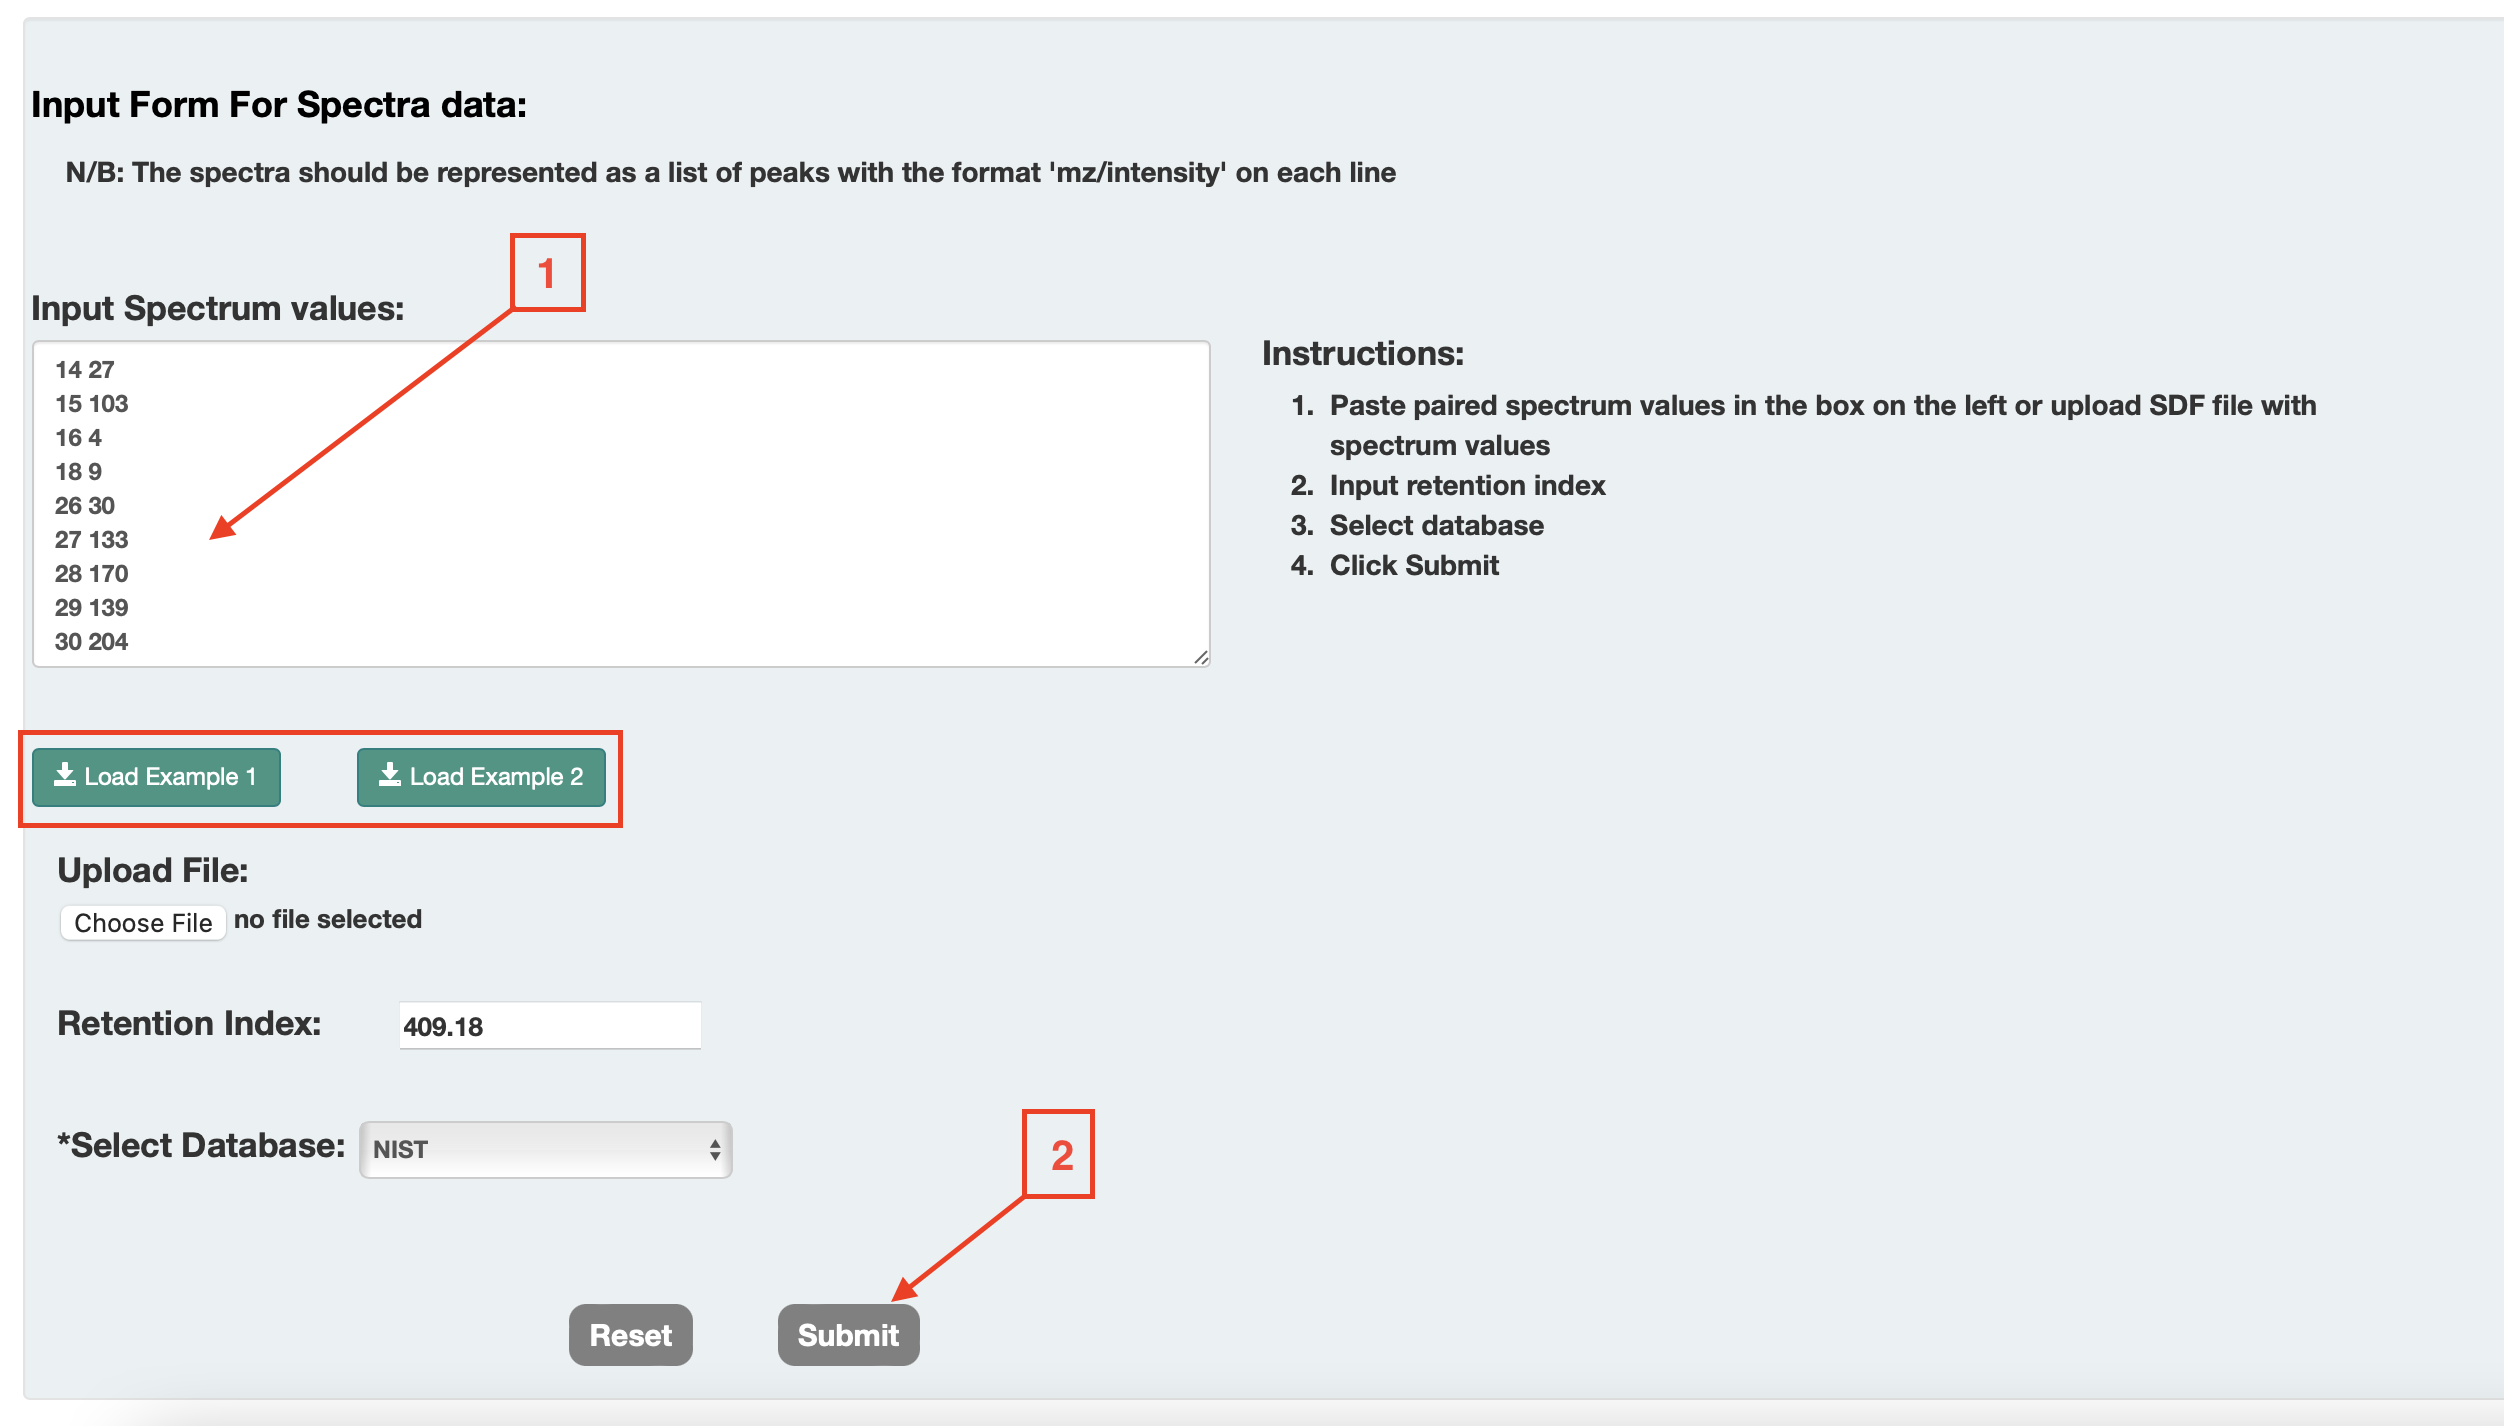
For Option 4(c) [Peak List]: In this option users can identify compounds. For this option, users can enter the peak list (masses and intensities) of their EI-MS spectrum into a box, the measured RI, the RI tolerance, the column type, the type of derivatization (default none) and the compound database to search (choice of HMDB, NIST compounds and HMDB+NIST) as Shown in Fig. 7 (a).
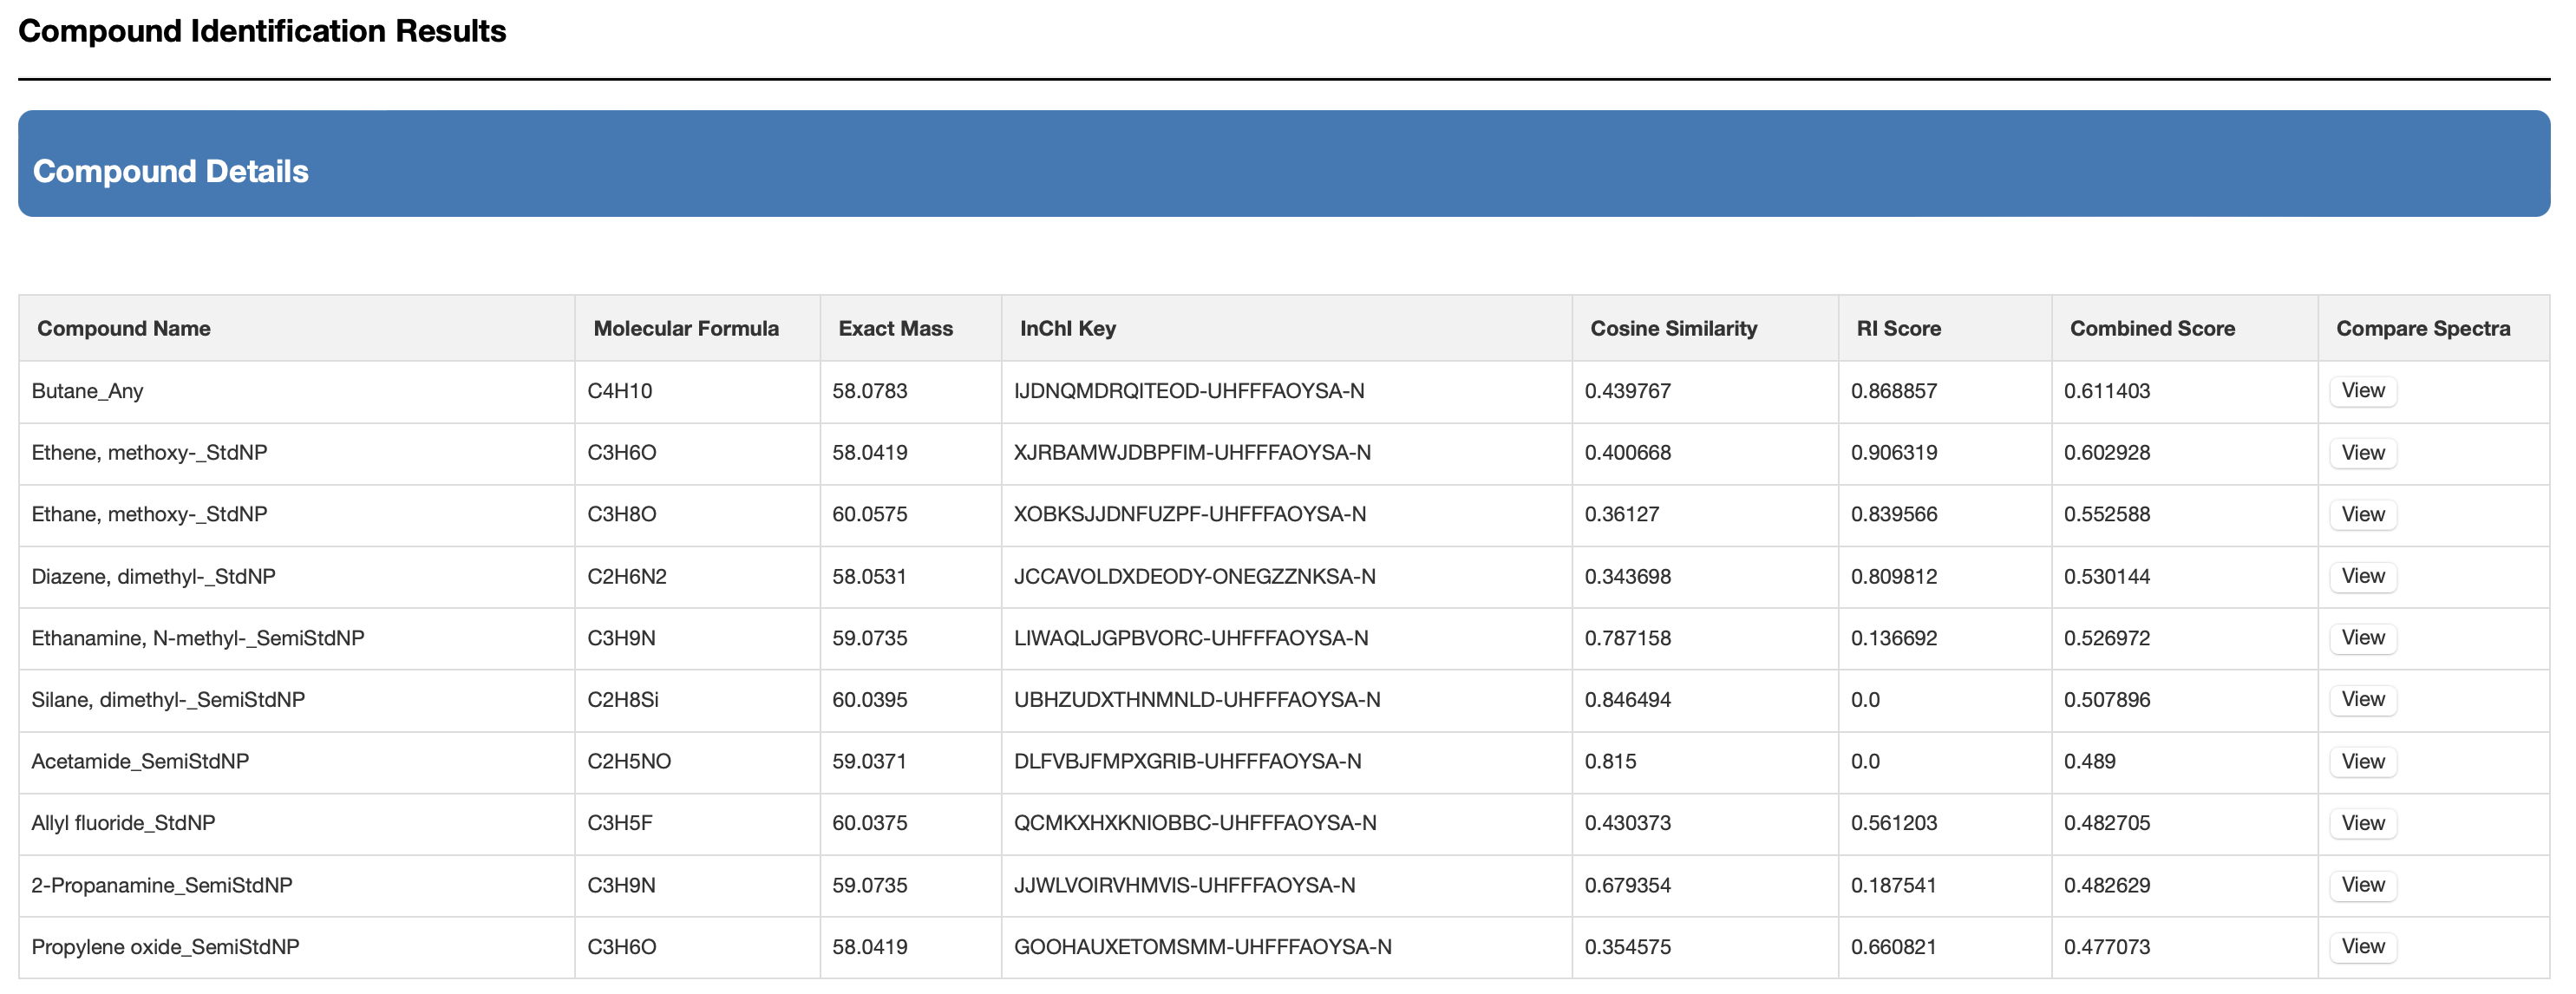
Once completed, users can press the submit button and a table or list of closely matching EI-MS spectra with matching RI values is provided on a new page. The list shows the structure name, the hyperlink to the structure in the database, the chemical structure (with links to JSMol, SMILES string and Download), the derivatization type, the predicted RI, the RI difference (absolute value), the RI matching score, the predicted EI-MS spectrum hyperlink (viewable by JSmirror plot), the cosine matching score and the sum of the cosine + RI matching score (called the combined score). The list is sorted by the combined matching score. The matches are kept consistent with the type of derivatization chosen. So, if the users choose TMS, only high scoring TMS derivatives are shown. If they choose TBDMS, only high scoring TBDMS derivatives are shown. If they choose no derivatization, only high scoring underivatized compounds are shown. Users can download the data from a download button located at the top of the output page as shown if Fig. 7(b)